

%20-%202026-04-27T104310.025.png)
US Port Intelligence ~ January-April 2026
From January through late April 2026, the container throughput picture at Long Beach, Los Angeles, and New York tells three very different stories. Overall performance here measures total hours from vessel arrival to cargo gate-out — the full supply chain clock. Higher numbers mean worse performance. A mid-March dwell crisis at Long Beach, a New York anchorage crunch in February, and an LA surge then correction all show up clearly in the data.
1.) Long Beach worst throughput day - 228 hours (Mid-March, driven by import dwell)
2.) New York max vessel wait - 63.9 hours (2.7 days at anchor, late February)
3.) Los Angeles avg throughput -74.8 hours (best of any port this period)
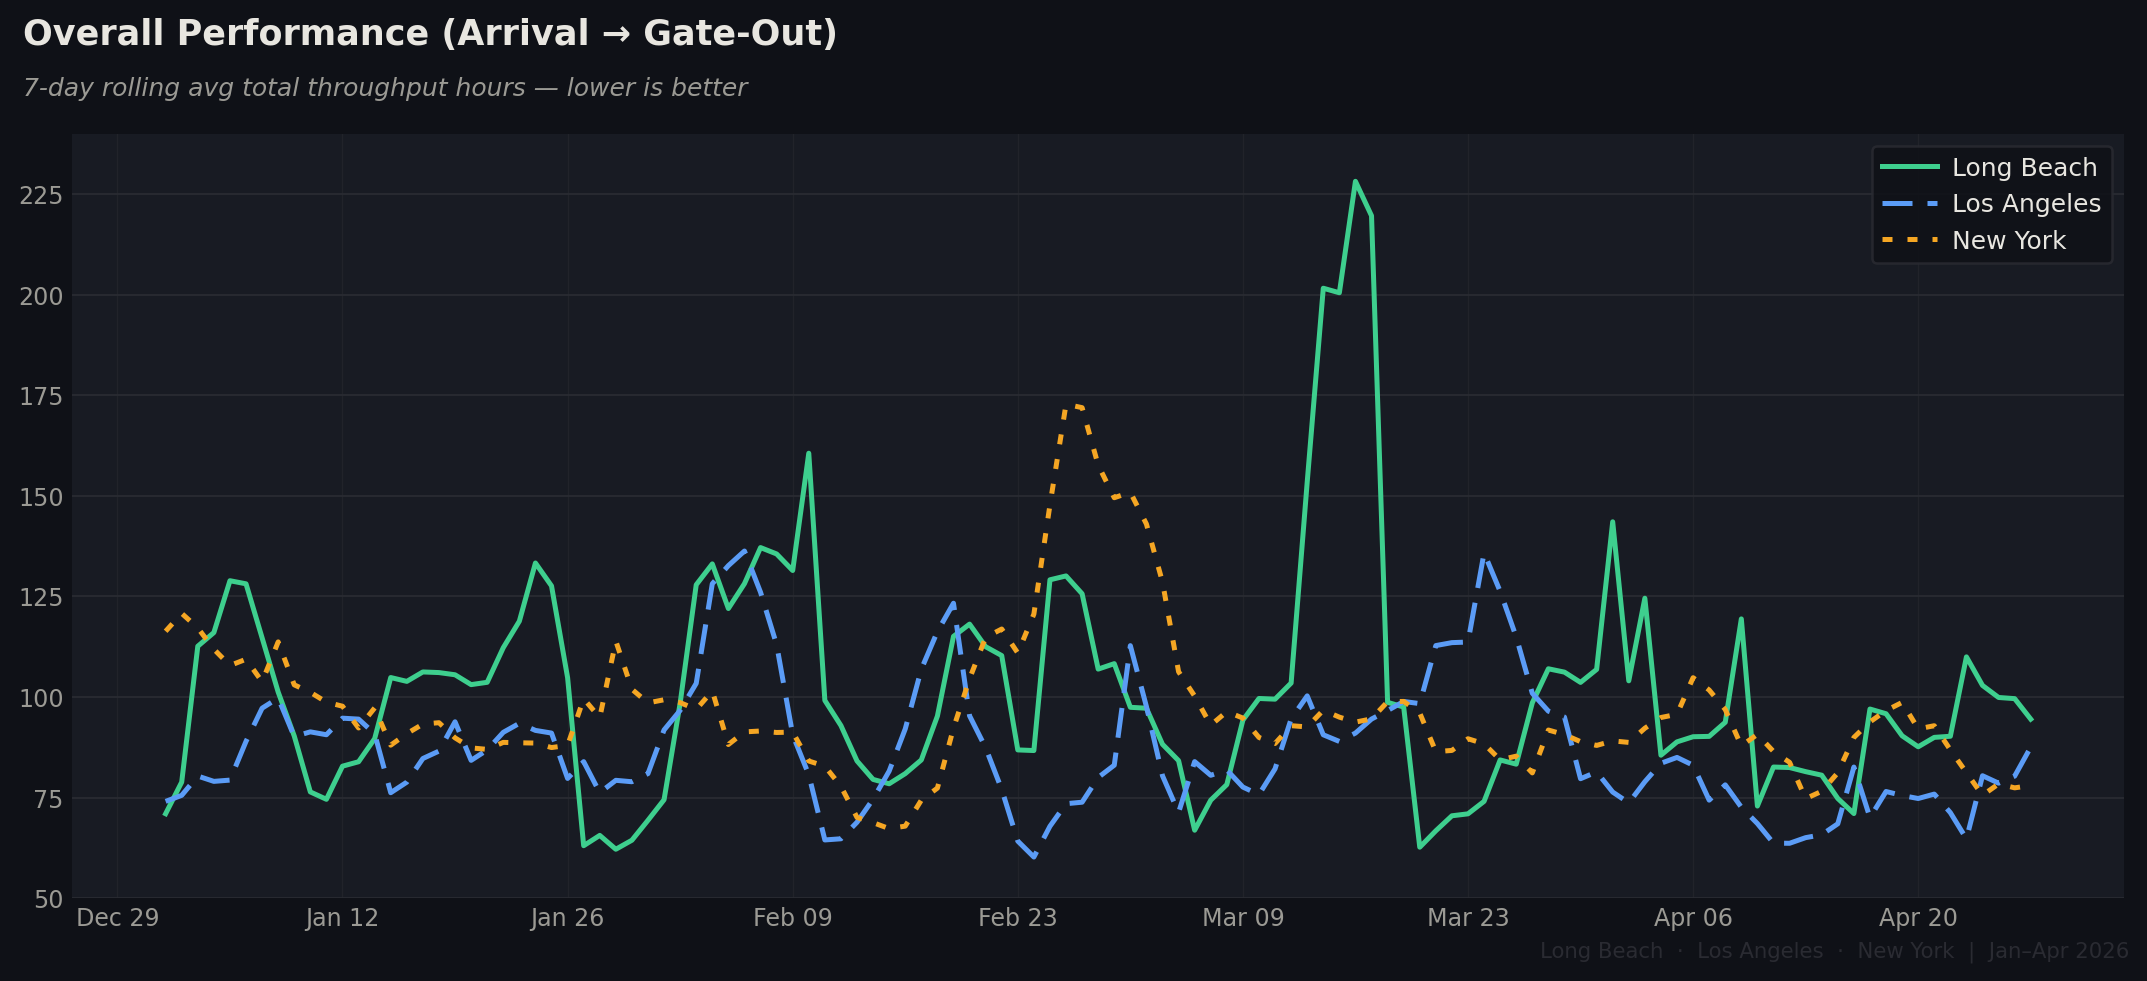
Long Beach's mid-March spike to 228 hours is the most severe congestion event of the period — and the dwell chart explains it directly: containers sat in terminal for up to 179 hours simultaneously. This was a landside crisis, not a vessel operations problem. New York opened January with elevated throughput hours around 116–120 before gradually improving. Los Angeles, by contrast, has shown the best trend: April's average of ~75 hours is the lowest reading of any port across the whole period.
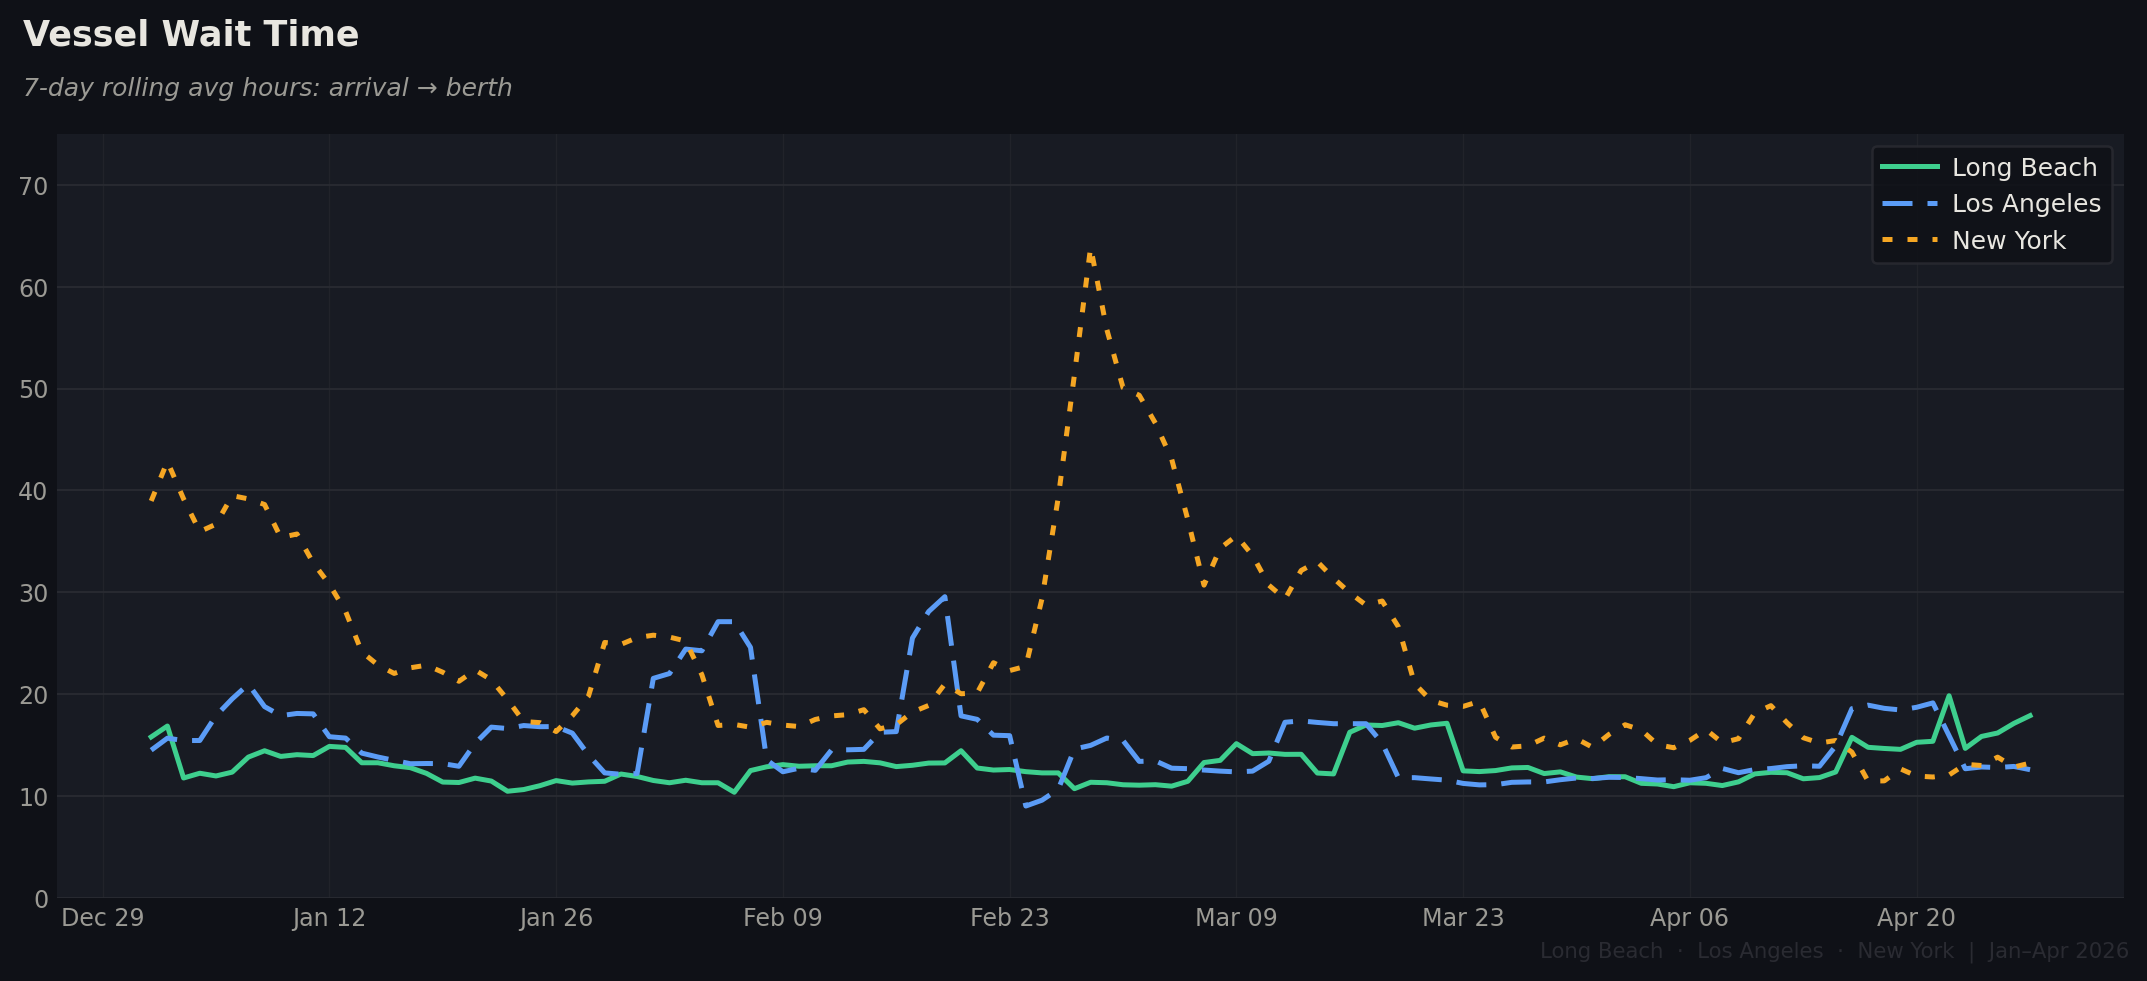
New York's late-February anchorage crisis is the defining vessel-side event of the period. Wait times surged from ~17 hours in early February to a peak of 63.9 hours around Feb 28 — ships sitting at anchor for nearly three days. The port largely cleared through April, dropping back to ~13 hours. LA also spiked in February (peaking near 29.6 hours) before resolving. Long Beach remained the most stable throughout, rarely exceeding 20 hours.
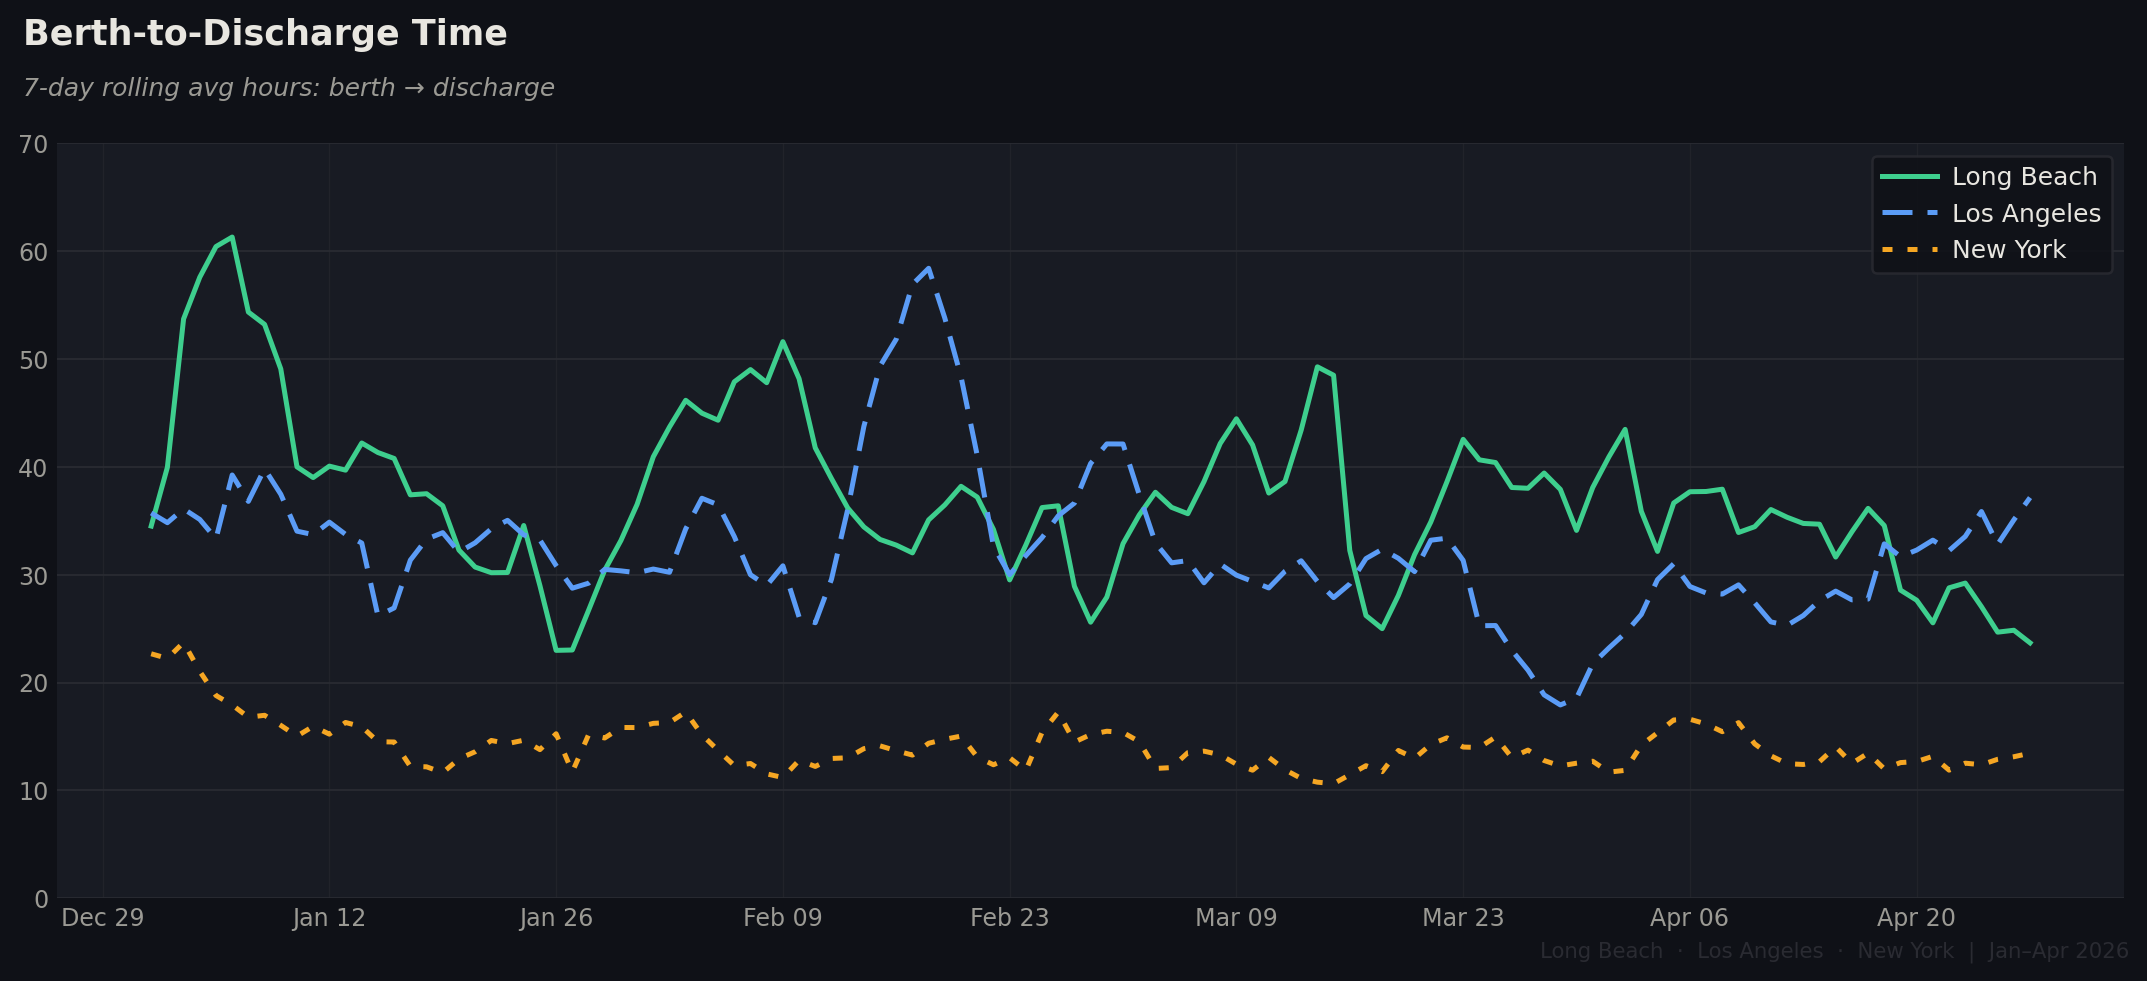
New York's crane productivity is a genuine structural advantage — averaging just 14 hours berth-to-discharge versus 37 hours at Long Beach and 32 hours at LA. The West Coast ports handle larger vessels with more containers per call, which inflates this number, but the gap is still striking. LA showed the most dramatic improvement: after peaking near 58 hours in late February, discharge time fell below 20 hours by late March — a meaningful operational gain.
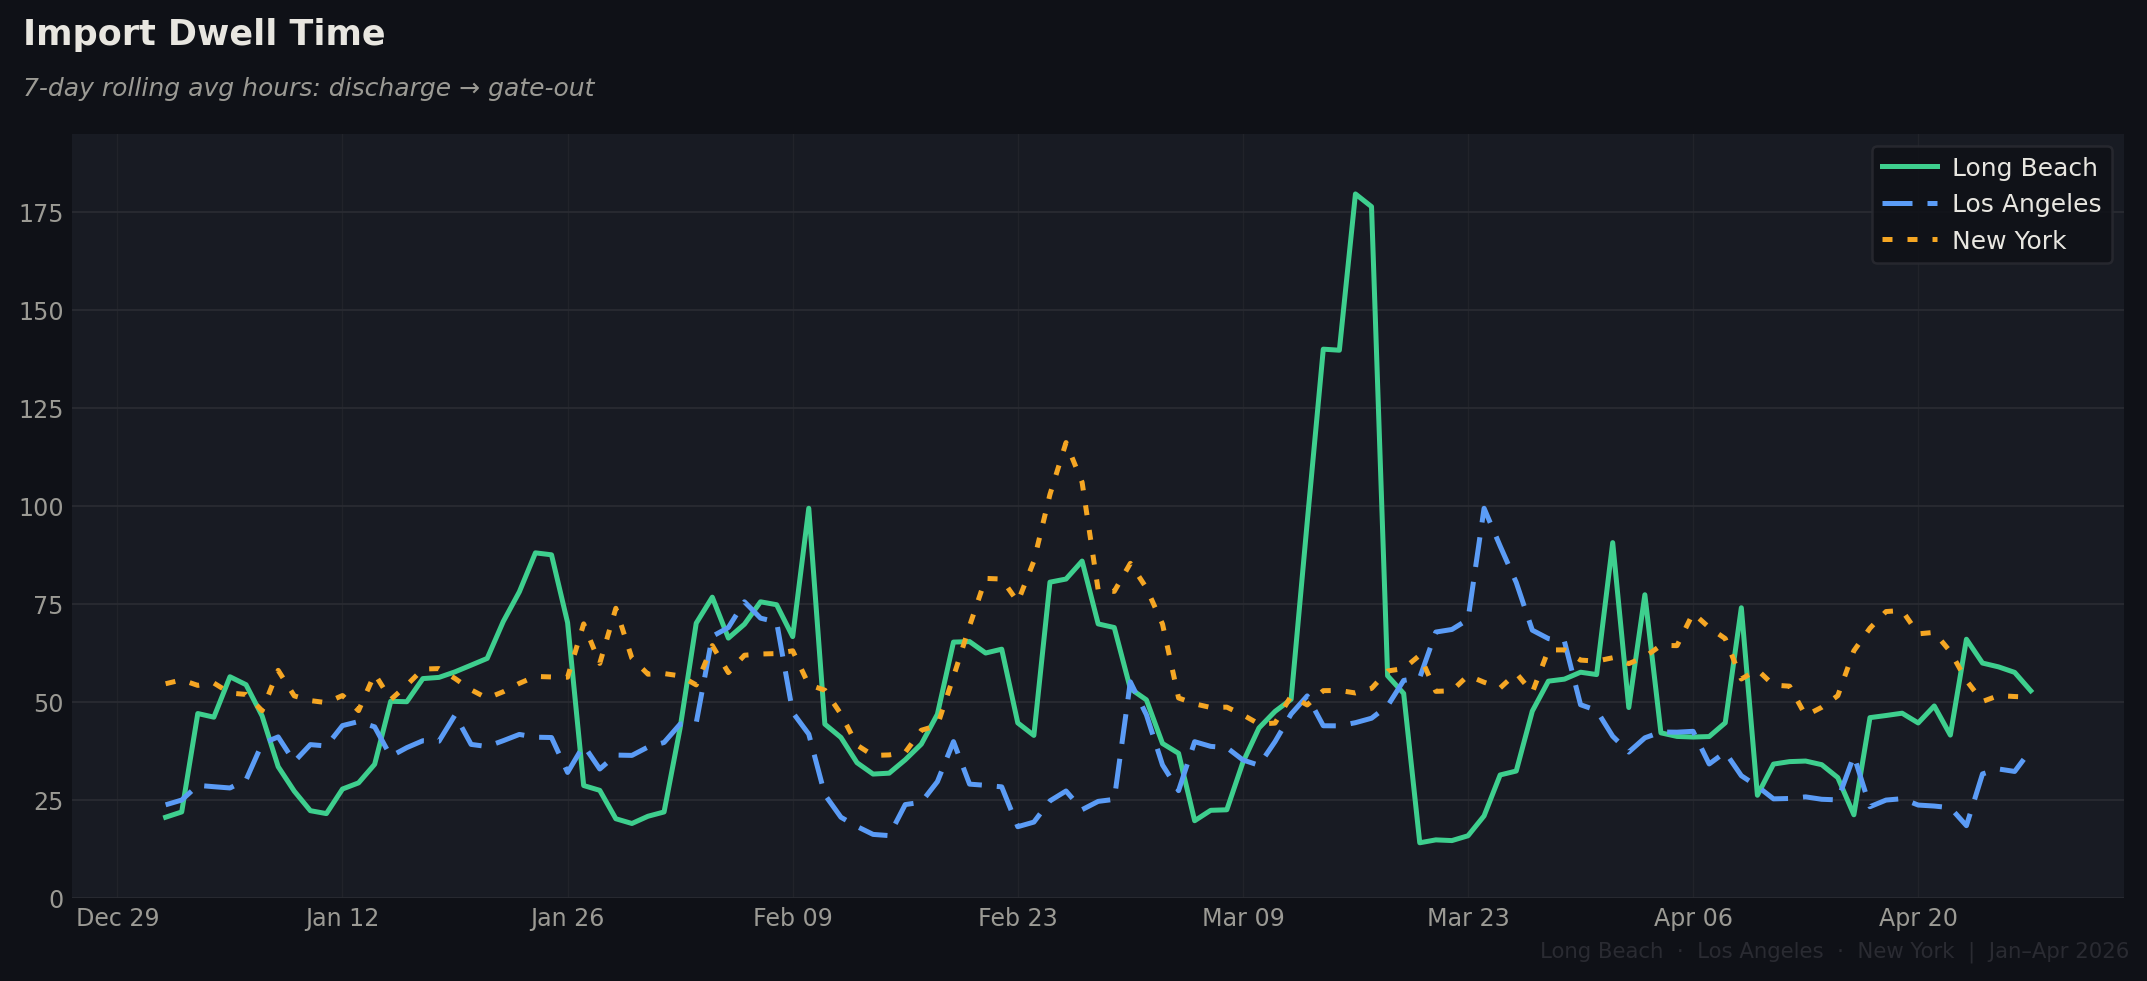
Dwell is the primary driver of Long Beach's overall performance deterioration — and the numbers capture the tariff front-loading surge in sharp relief. Long Beach hit 179.6 hours in mid-March, cargo sitting in terminal for over a week. New York's 116-hour peak in late February and LA's 99-hour spike in late March reflect the same import surge hitting different gateways at slightly different times. All three have since normalized, suggesting the pre-tariff pull-forward wave has largely cleared.
Port Verdict - January-April 2026
1.) Long Beach - Worst overall throughput hours of the three. The March dwell crisis (179 hrs in terminal) was the key driver — a landside problem, not a vessel one. Now recovering.
2.) Los Angeles - Best throughput performance in April as surge cargo cleared. Berth-to-discharge improved dramatically through Q1. The port to watch as volumes normalize.
3.) New York - Feb anchorage crisis (64hr wait) was severe but resolved. Fast crane ops are a structural strength. Dwell remains the persistent weak point at ~51–60 hrs.
Powered by Vizion
This level of port intelligence is avilable for every gateway you import or export through.
Vizion gives logistics and supply chain teams the data to measure, benchmark, and act on port performance. Vessel wait, dwell time, berth-to-discharge, and total throughport across all major import and export ports. Stop reacting to the delays after the fact. Start seeing them before they impact your cargo. Schedule time for a demo below.
%20-%202026-07-17T152701.754.png)
%20-%202026-07-17T104412.520.png)
%20-%202026-07-08T100322.158.png)


