

%20-%202026-04-08T190632.349.png)
As China-sourced freight faces mounting headwinds, Cambodia is emerging as one of the fastest-growing origins in trans-Pacific trade, and the data tells a striking story of acceleration, diversification, and carrier repositioning.
When the tariff landscape began shifting in earnest, freight markets started watching Southeast Asia closely. But the Cambodia story has moved beyond "emerging alternative" territory. Q1 2026 data shows a corridor that has fundamentally repriced in terms of volume, product mix, and carrier investment, in the span of roughly 12 months.
The weekly booking trend: a corridor that found its footing
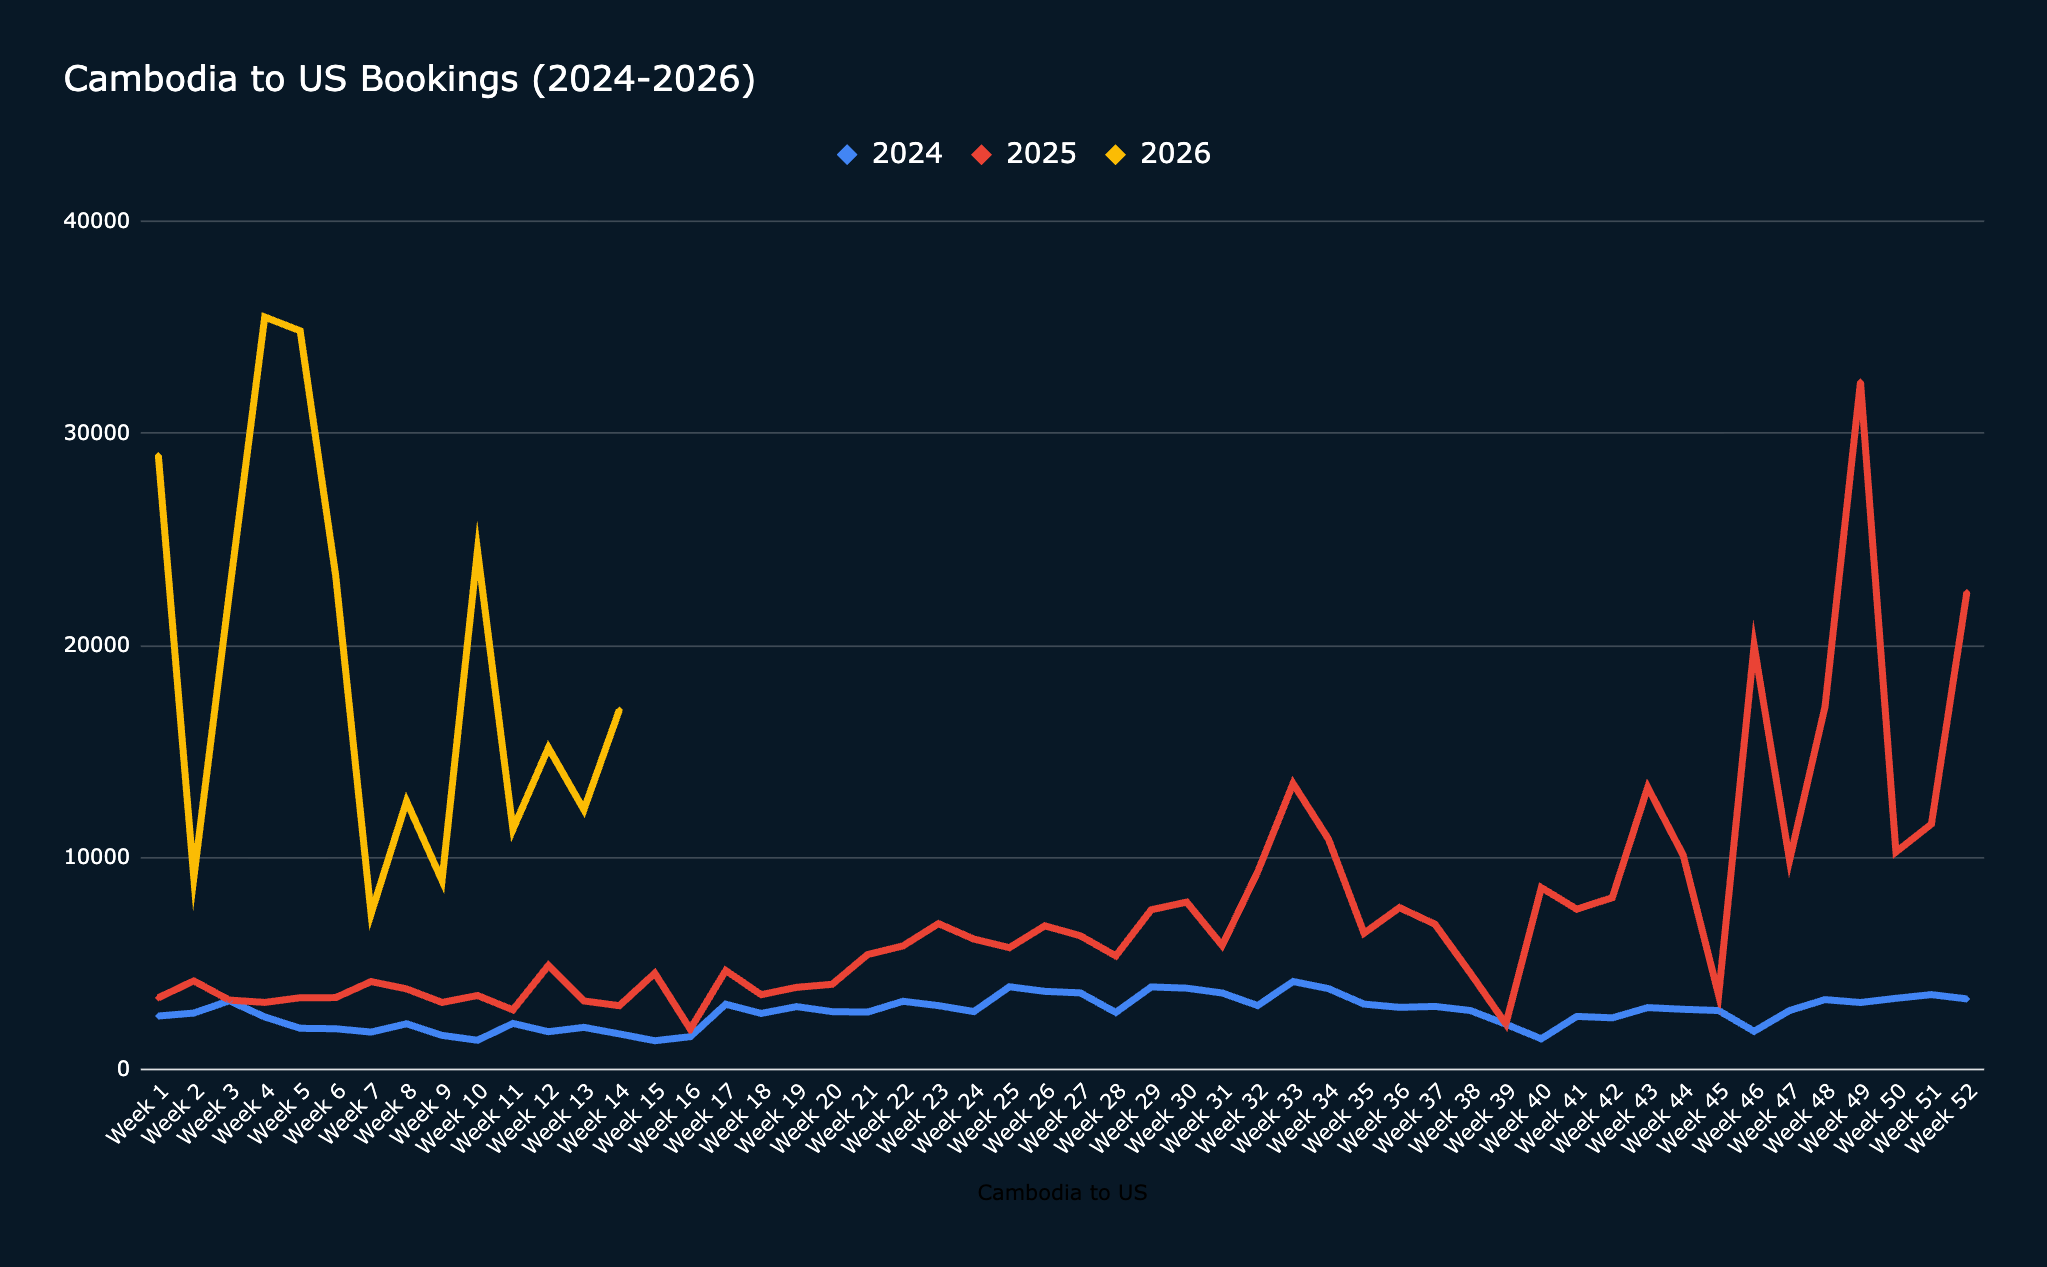
The weekly booking data reveals a corridor that went from modest and seasonal in 2024 to structurally elevated through 2025, and then broke to a new level entirely in early 2026. The step-change is not a single-week anomaly; it is a sustained re-rating of the lane.
What is moving: product diversification takes hold
Perhaps the most telling signal of Cambodia's supply chain maturation is the breadth of product categories now flowing through the corridor. This is not a single-category surge; it is a multi-vertical shift.

Footwear (HS 64) is the headline story, with volumes growing from roughly 3,200 to over 50,000, a 1,476% increase. The more strategically significant development is the appearance of entirely new categories: metal hardware (HS 83) and wood pulp and packaging inputs (HS 04) had no meaningful Q1 2025 presence and are now registering thousands of TEUs. Industrial belting and conveyors (HS 59) jumped from 390 to over 7,100. This is a supply chain ecosystem forming, not just one industry fleeing China.

Carrier share: CMA CGM dominates, but the field is moving
The carrier landscape on Cambodia to US reflects how quickly this corridor went from a secondary lane to a priority one. CMA CGM has taken a commanding position, but every major carrier has grown volume. The pie is simply much larger.

CMA CGM's share is striking. At 196,148 TEUs it accounts for roughly 83% of total tracked carrier volume, up from a dominant but less extreme position in Q1 2025. MSC sits second at 16,790, with Maersk, ONE, Zim, and Hapag-Lloyd rounding out an increasingly competitive field. Notably, ONE is the only carrier showing a Q1 decline year-over-year (4,108 vs 4,869), suggesting potential service realignment or capacity redeployment.

Gateway ports: Houston rises, Los Angeles holds
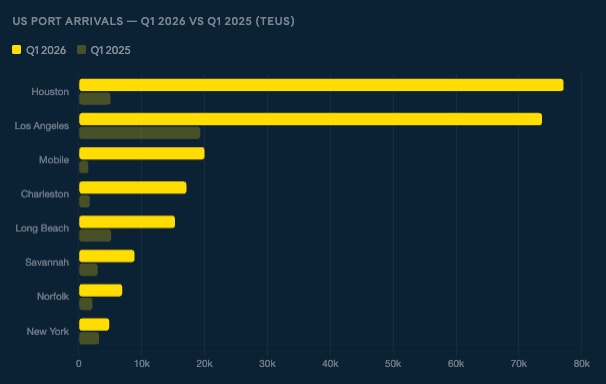
The destination port mix tells its own story about supply chain reconfiguration. While Los Angeles remains a top gateway by volume, Houston has surged to the number one spot, a reflection of both distribution footprint shifts and the retail and industrial product mix now flowing out of Cambodia.
Houston's emergence as the top destination port, overtaking LA, is noteworthy. The Gulf Coast has historically been a secondary option for trans-Pacific importers, but the scale of volume now arriving at Houston (77,111 TEUs, up from just 5,022) suggests active supply chain restructuring by major shippers seeking inland distribution efficiency. Mobile is another Gulf winner, growing more than 13x year-over-year. On the East Coast, Charleston and Savannah are both growing, while New York remains relatively flat.
Walmart's Cambodia pivot: the most visible reshoring story
No single shipper illustrates the China-to-Cambodia shift more clearly than Walmart. The retailer's supplier profile has been dramatically rewritten between Q1 2025 and Q1 2026, with Chinese-origin suppliers replaced almost entirely by Cambodia-based manufacturers producing similar product categories: outdoor goods, recreational equipment, and toys.
The supplier name patterns visible in the 2026 data are telling. "Sun Pleasure," "Ocean Union Sports," "Liefeng Outdoors," and "K Cambodia" all point to outdoor and recreational product lines, categories long dominated by Chinese manufacturers. These appear to be newly established or rapidly expanded Cambodian operations standing up production capacity at scale.
What to watch: the questions this data raises
The Cambodia corridor has arrived, but several dynamics will determine how durable this shift proves to be. First, how much of the Q1 2026 surge represents genuine demand versus tariff-driven pull-forward? The week-over-week data shows extraordinary front-loading in January and February, which may precede a lull. Second, can Cambodia's port and logistics infrastructure absorb continued volume growth? Sihanoukville is the primary export gateway, and capacity constraints could become a real ceiling on corridor expansion. Third, CMA CGM's 83% carrier share concentration is unusual. As this becomes a high-priority lane, expect MSC, Maersk, and others to compete more aggressively for capacity. Finally, the emergence of Gulf Coast ports as primary gateways suggests that mass-market retailers are driving much of this volume to their heartland distribution networks, a structural shift that could prove stickier than trade-policy-driven moves.
For freight stakeholders, Cambodia is no longer a corridor to monitor. It is one to actively position around.
See the full picture with Tradeview
Access complete shipper profiles, supplier-level bill of lading data, carrier share trends, and corridor analytics across every major trade lane. Updated daily. Book a demo below for access.
%20-%202026-07-08T100322.158.png)
%20-%202026-07-02T085236.864.png)
.png)


