

.png)
Q1 2026 opened with a striking surge of pre-tariff front-loading, then softened sharply as shippers absorbed elevated import levels and uncertainty clouded the outlook. This report breaks down weekly booking trends, port performance, commodity flows, and carrier share shifts — giving you the data to make faster, smarter decisions.

Weekly booking trends: the front-load surge and the pullback
The story of Q1 2026 is two acts. Weeks 1–4 saw robust volumes as importers rushed to beat anticipated tariff increases, with Week 3 topping 368K TEU — slightly above the same period in 2025. From Week 5 onward, bookings softened considerably, with Week 8 collapsing to just 154,730 TEU — the sharpest single-week dip in the dataset due to Chinese New Yea. By Week 13, volumes were recovering toward 352K TEU, signaling a floor may have been found.

Week 8 2026 (154,730 TEU) was 56.9% below the same week in 2025 (359,491 TEU) — a dramatic pullback likely driven by front-loading fatigue and the Chinese New Year holiday convergence. It stands as the weakest comparable week across all three years in this dataset.
Port performance: winners and losers in Q1 2026
The port picture is nuanced. Houston surged +17.1% year-over-year, emerging as the standout growth story of Q1. LAX held its top position despite a modest decline. Meanwhile, several major East and Gulf Coast ports saw meaningful volume erosion — particularly Savannah (−7.1%), Long Beach (−12.4%), and Seattle (−22.2%), which posted the steepest relative decline among major ports.

Houston's 17.1% YoY gain to 464K TEU suggests significant trade lane diversion — possibly from West Coast ports facing labor uncertainty and from importers diversifying port risk. Tianjin-linked flows into USTIW dropped 44.6%, the largest proportional decline of any port in the dataset.
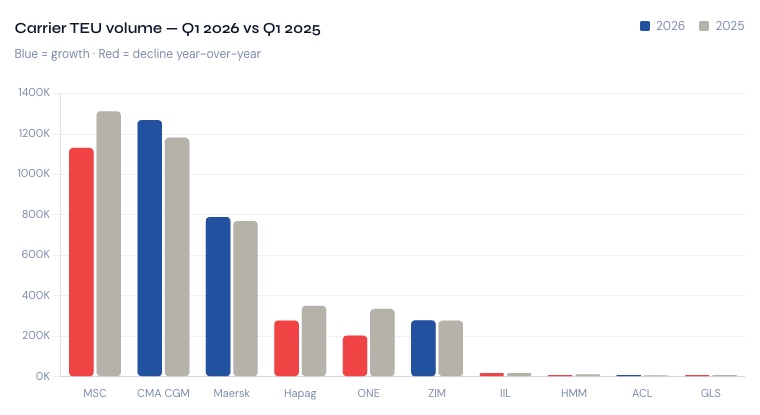
Carrier share: CMA CGM gains as MSC pulls back
The carrier landscape shifted materially in Q1 2026. MSC — the market leader in 2025 — saw volumes fall from 1.31M to 1.13M TEU (−13.8%). CMA CGM overtook MSC in absolute volume with 1.27M TEU (+7.3%), claiming the top spot for the quarter. Maersk held steady with modest growth. Most striking was ONE's 39.2% volume decline and Hapag-Lloyd's 20.6% fall, suggesting alliance reconfigurations and shipper preference shifts are reshaping the competitive order.
Shipper alert: If your contracted carrier is among those showing significant volume declines, revisit actual capacity delivery against contractual commitments. Alliance reshuffles often create gaps between booked and delivered space.
Commodity flows: furniture dominates, some categories surge
HS code 9403 (furniture) remained the top imported commodity by TEU in Q1 2026, growing 6.2% to 234,664 TEU — a sign that residential and commercial construction demand is holding. Chapter 64 (footwear) posted a strong 24.1% increase. Meanwhile, plastics (HS 3918/3926) showed mixed results, and automotive-adjacent codes saw moderate softening. The top 25 HS codes accounted for a significant share of total Q1 volume, with notable divergence between consumer goods (rising) and industrial inputs (flat to declining).

HS 6130 (knitted/crocheted fabrics) jumped 65.3% YoY to 30,009 TEU, the largest proportional gain among top commodities. HS 6474 (other footwear parts) grew 24.1%. These sharp moves suggest front-loading strategies were concentrated in specific apparel and footwear supply chains ahead of tariff deadlines.
Five executive insights from Q1 2026
The data tells a clear story for anyone paying attention. Here are the five signals that should be driving strategic decisions right now.
1. Front-loading is real — but the hangover is coming. Q1 2026 volumes were front-loaded into Weeks 1–4 as importers anticipated tariff escalation. The Week 8 collapse to 154K TEU suggests the pull-forward effect has already created a demand air pocket. Expect softer Q2 bookings, particularly in categories that surged in Q1.
2. Houston is the port story of 2026. A 17.1% YoY gain positions Houston as the beneficiary of both nearshoring flows from Latin America and continued West Coast port risk diversification. Supply chain planners should revisit inland distribution assumptions if this trend holds into Q2.
3. CMA CGM's rise signals alliance power shift. CMA CGM overtaking MSC by volume in Q1 is significant. Combined with ONE and Hapag-Lloyd's steep declines, the data suggests cargo allocation within the new alliance frameworks is still settling. Shippers should pressure-test rate agreements against actual capacity delivery.
4. Furniture and apparel are leading indicators to watch. HS 9403 (furniture) and HS 64xx (footwear) continued to grow in Q1 despite the broader slowdown. These consumer goods categories tend to be highly sensitive to tariff timing and are worth monitoring weekly as a real-time demand signal.
5. Full-year 2026 is at risk of undershooting 2025. At the current pace, Q1 2026 is tracking 7.3% below Q1 2025. Unless Q2 and Q3 see a meaningful rebound — which would require both tariff clarity and restocking demand — total 2026 import volumes may fall meaningfully short of last year's levels.
See every booking, every week — before your competition does
The data in this report is a snapshot. TradeView gives you live weekly booking intelligence across ports, carriers, commodities, and trade lanes — updated as cargo moves. Leading importers, freight forwarders, and logistics teams use TradeView to outmanoeuvre market volatility. Book a demo below.
%20-%202026-07-08T100322.158.png)
%20-%202026-07-02T085236.864.png)
.png)


