

%20-%202026-04-23T144430.683.png)
The near-closure of the Strait of Hormuz didn't just disrupt shipping lanes. It broke the playbook analysts have used for decades to understand global trade flows — and replaced it with something far more complex, multimodal, and harder to see.
At Vizion, we've been watching this unfold in real time through our TradeView platform. What the container booking data shows is not a gradual slowdown. It's a cliff.
TL;DR: UAE outbound container volumes fell 73.5% from February to March 2026, with the first 17 days of April tracking even lower. Kuwait dropped 76%. Qatar fell 60%. Oman — the only Gulf origin outside the strait — grew 29%. Turkey's inbound volumes surged 27% as overland corridors absorbed rerouted freight. And the traditional tools analysts rely on — AIS, satellite imagery, trade manifests — were reported to have degraded at the exact moment they were needed most.
Gulf Container Volume Data: February Through Mid-April 2026
Our container booking data covers February 1 through April 17, 2026. February and March are complete months. April reflects only the first 17 days and should be read as a directional signal, not a full monthly comparison — but the direction is clear.
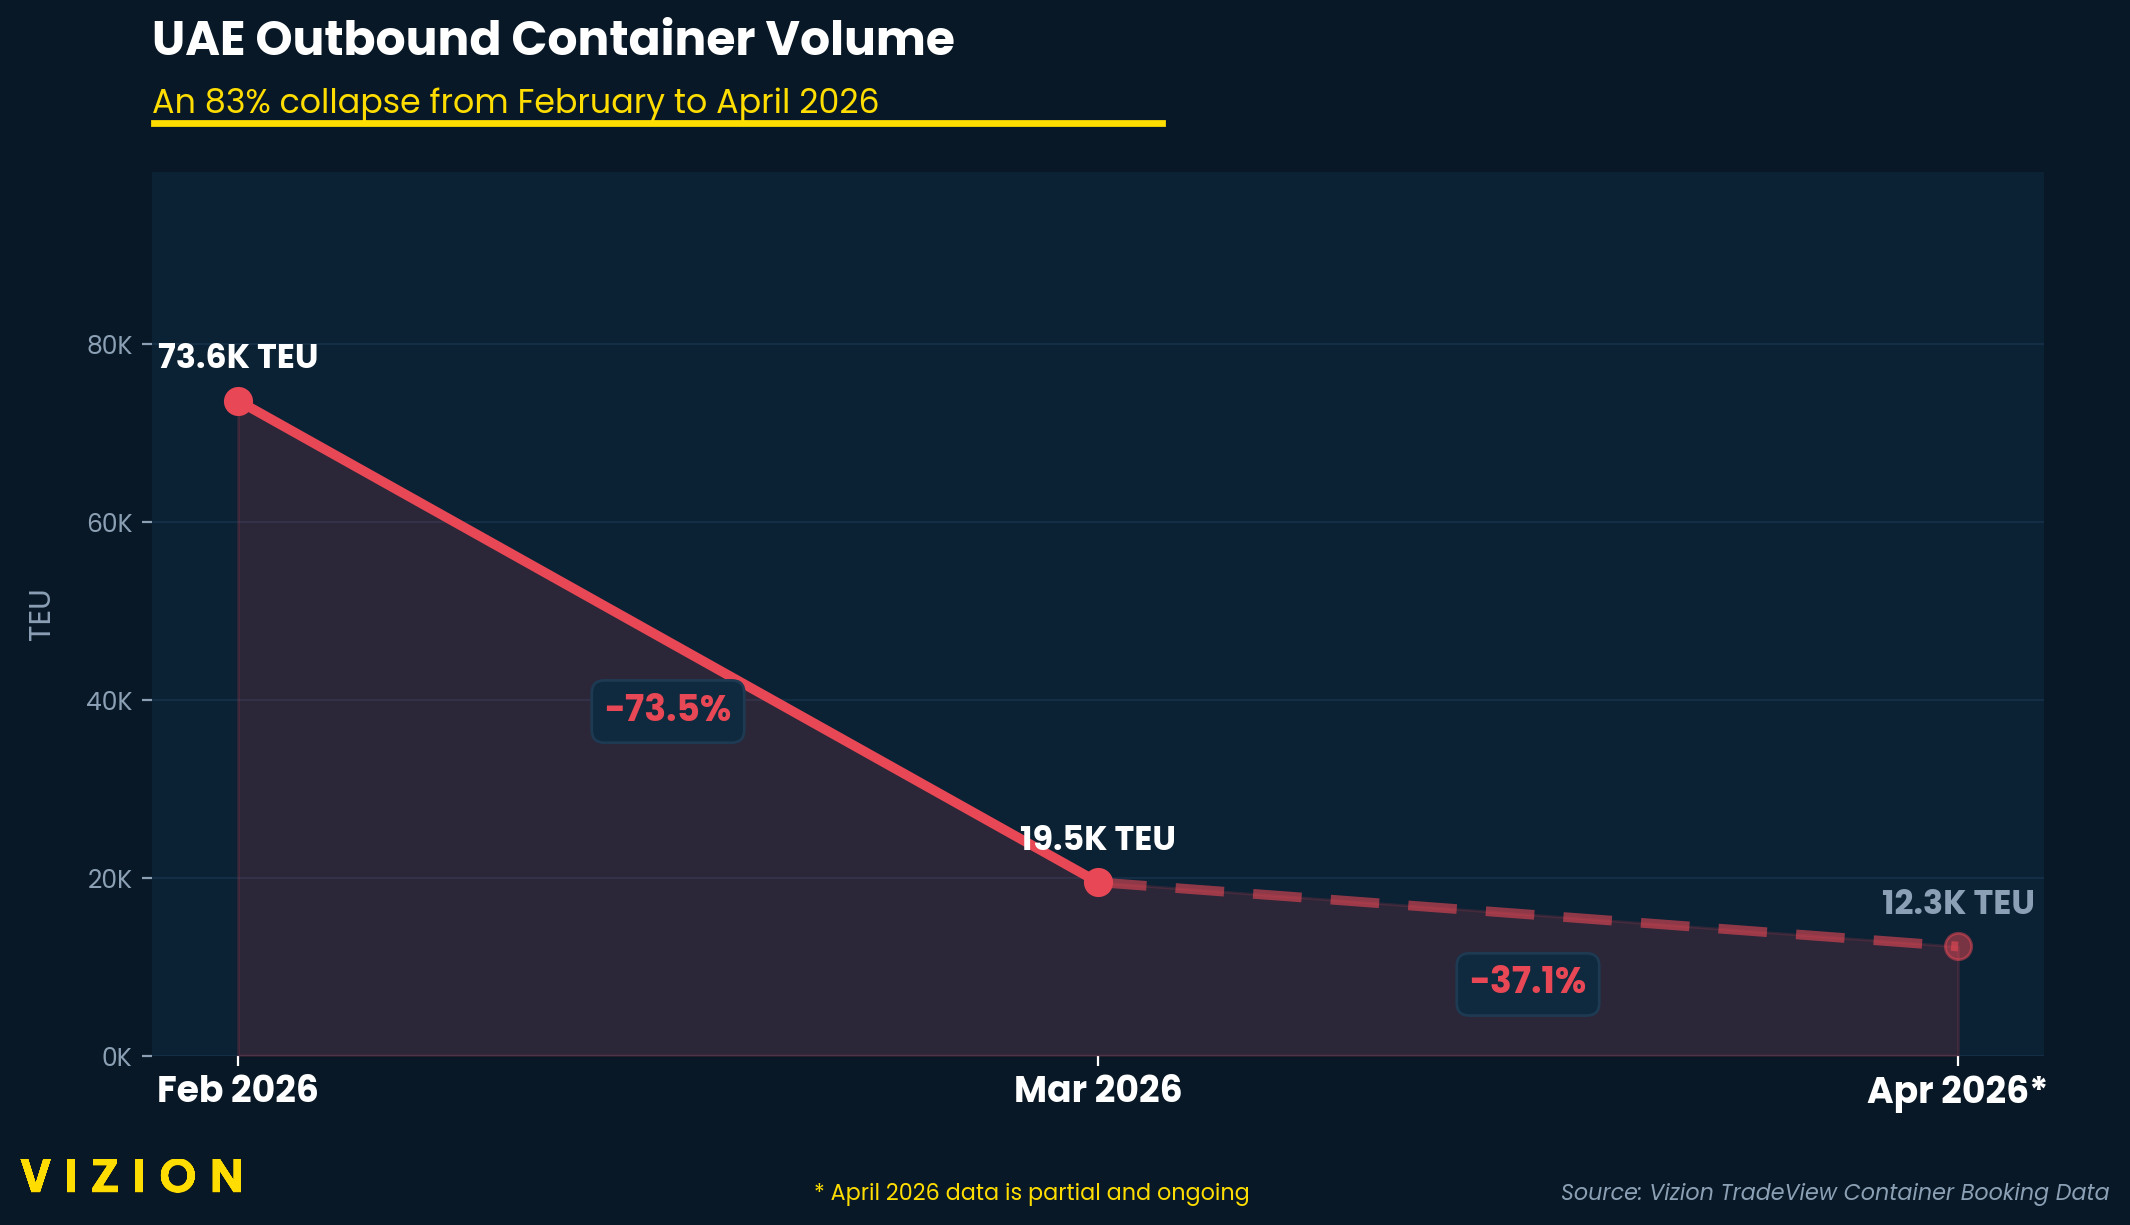
UAE outbound volumes collapsed 73.5% from February to March. From roughly 73,600 TEU in February to under 19,500 TEU in March. Through April 17, volumes had tracked at approximately 12,200 TEU for that partial period — with no sign of recovery.
Kuwait fell 75.6% from February to March, going from approximately 1,189 TEU to under 290 TEU.
Qatar dropped nearly 60% from February to March, from approximately 1,619 TEU to approximately 657 TEU.
These are not rounding errors or seasonal dips. These are near-total supply chain shutdowns — visible in booking data before most traditional analysis tools could even register that something was wrong.
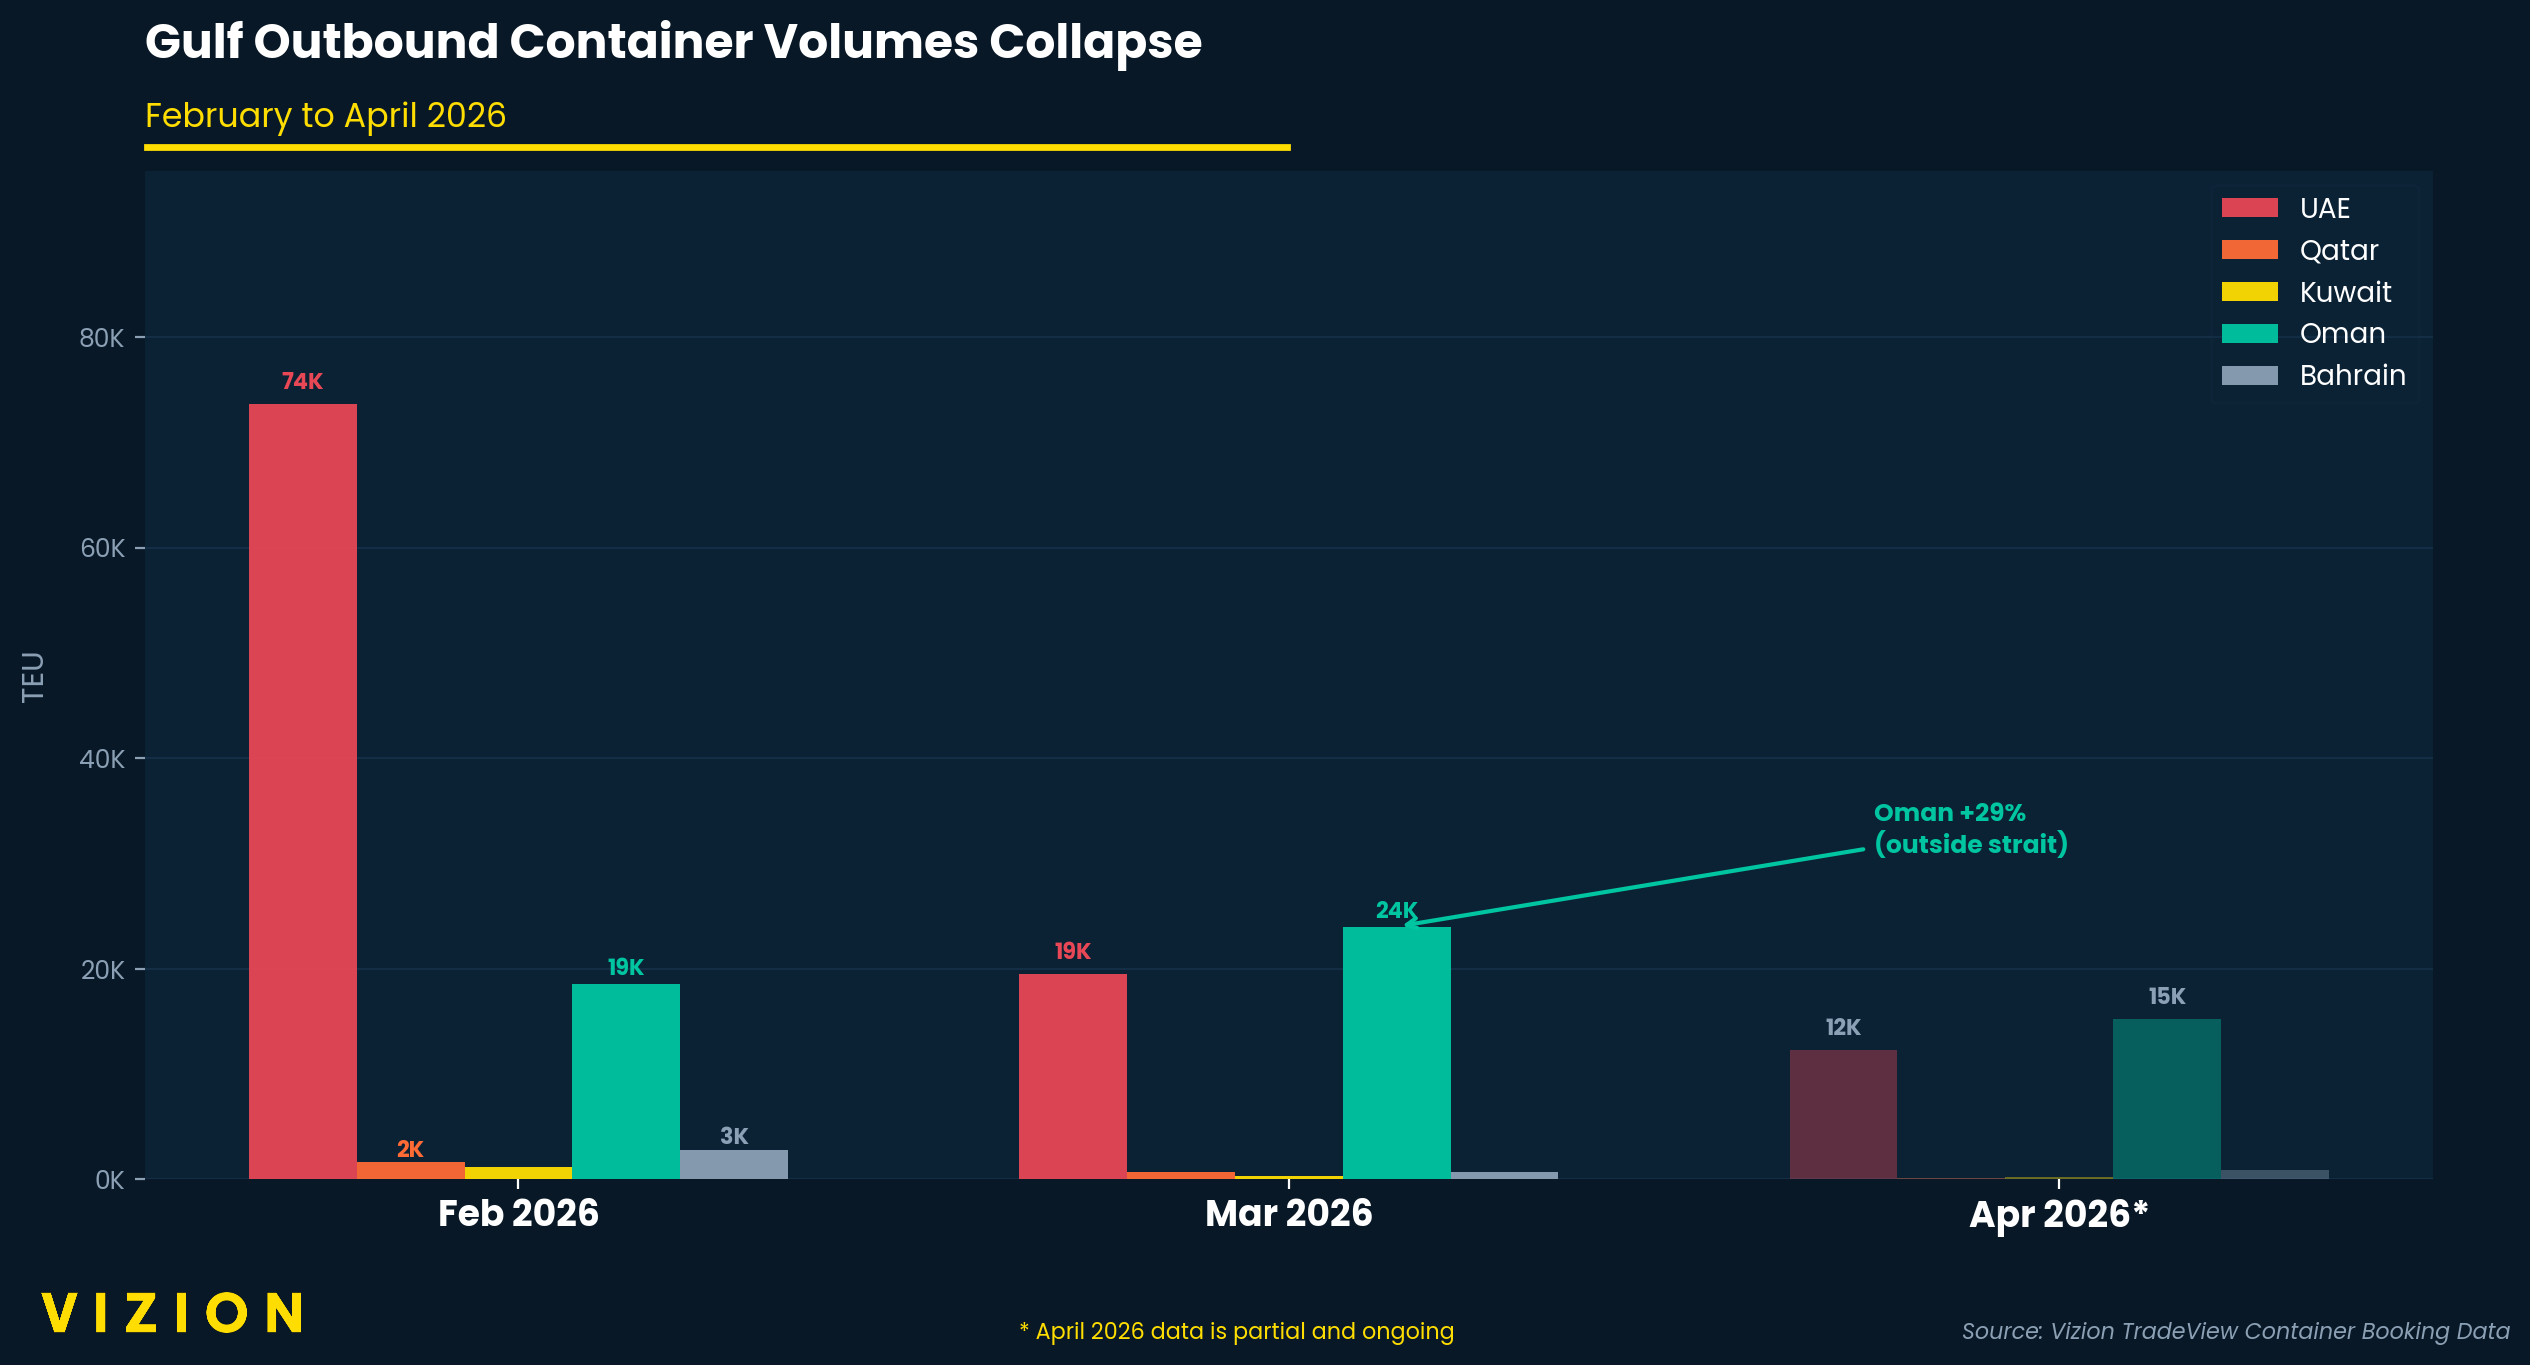
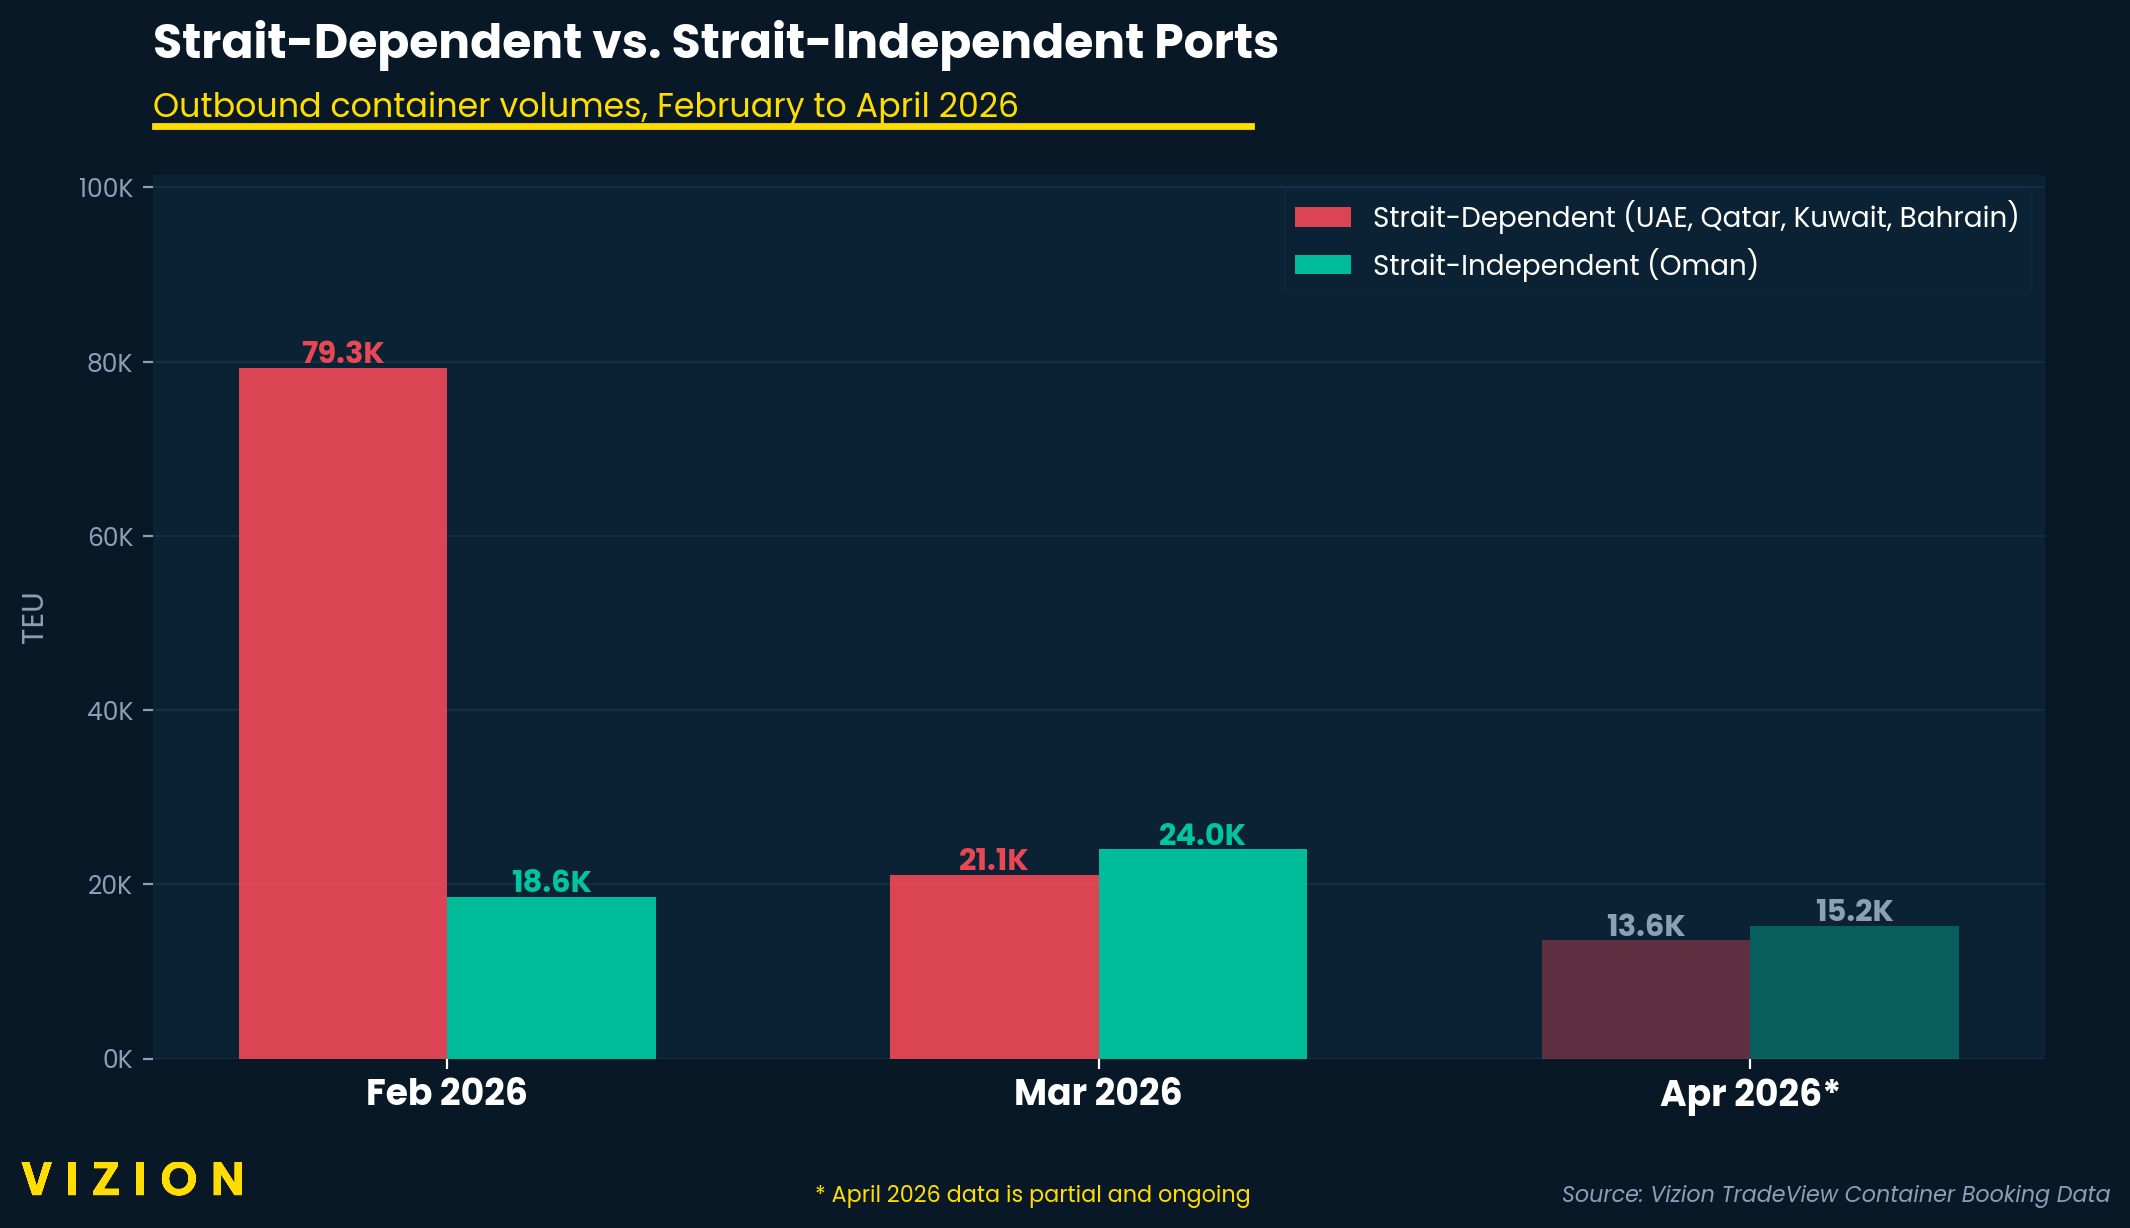
The one exception? Oman, which actually grew 29% in March, climbing from approximately 18,557 TEU to approximately 24,007 TEU. That is not a coincidence. Oman's major container ports — Salalah and Sohar — sit on the Arabian Sea side of the strait. When Hormuz closes, Oman becomes the only Gulf maritime option still open.
The Analysis Layer Broke Too
Here's the part of this story that is underreported: the disruption didn't just hit the shipping lanes. It appears to have hit the data infrastructure analysts rely on to understand the shipping lanes — at the same time.
AIS coverage degraded significantly. According to maritime analytics firm Kpler, AIS spoofing rates in the region had already reached approximately 18% before this escalation, with dark-fleet activity up sharply year-on-year. Reports from the period indicate that vessel transponders were being switched off at scale, with tanker runs to Iranian ports occurring without transponder pings.
Satellite imagery of the region was restricted. Planet Labs announced an indefinite suspension of Iran and regional imagery, reportedly at the US government's request — a development confirmed by Reuters, BBC, and SatNews. For maritime analysts who rely heavily on commercial satellite data, this was a significant loss of visibility precisely when demand for that visibility was highest.
Trade manifest data became less reliable. A growing share of vessels reportedly still moving were tied to sanctioned operators or shadow-fleet owners whose cargo does not clear through the systems that populate commercial trade databases — meaning an unknown volume of freight was effectively invisible to standard analysis tools.
The result, as reported by multiple outlets covering the crisis, was that analysts were improvising: arranging small boat access to visually count stalled tankers, cross-referencing port agent calls, and relying on AIS gap detection to infer dark activity rather than observe it directly.
This points to a broader structural issue: chokepoint disruptions tend to degrade both the supply chain and the tools used to analyze it, at the same moment you need those tools most. Companies that can see their own shipment data in real time — through their own bookings and carrier relationships — are less exposed to this blind spot than those relying entirely on public feeds.
Turkey and Saudi Arabia: The New Container Trade Corridors
As the maritime route through the Gulf became unreliable, ocean carriers began rerouting containers overland. Two countries emerged as the primary land bridges, based on both industry reporting and our own container booking data.
Saudi Arabia emerged as the dominant Gulf land corridor. Carriers — including Maersk, which published an operational update on April 17 confirming the routing — began accepting containerized bookings through Red Sea ports (Jeddah and King Abdullah Port), then trucking or railing cargo across Saudi territory to Dammam on the Gulf side, bypassing Hormuz entirely. The Saudi Landbridge railway corridor (Jeddah to Riyadh to Dammam) moved from a long-planned infrastructure project to an operationally critical route in a short window.
Turkey became the secondary bridge — particularly for trade flowing into Iran, Iraq, and the Levant. Turkish ports like Mersin and Iskenderun absorbed container volume that would have moved through Gulf ports directly. Reports from the period also noted the first overland Iraqi fuel convoy moving through Syria in late March, reopening a long-dormant corridor.
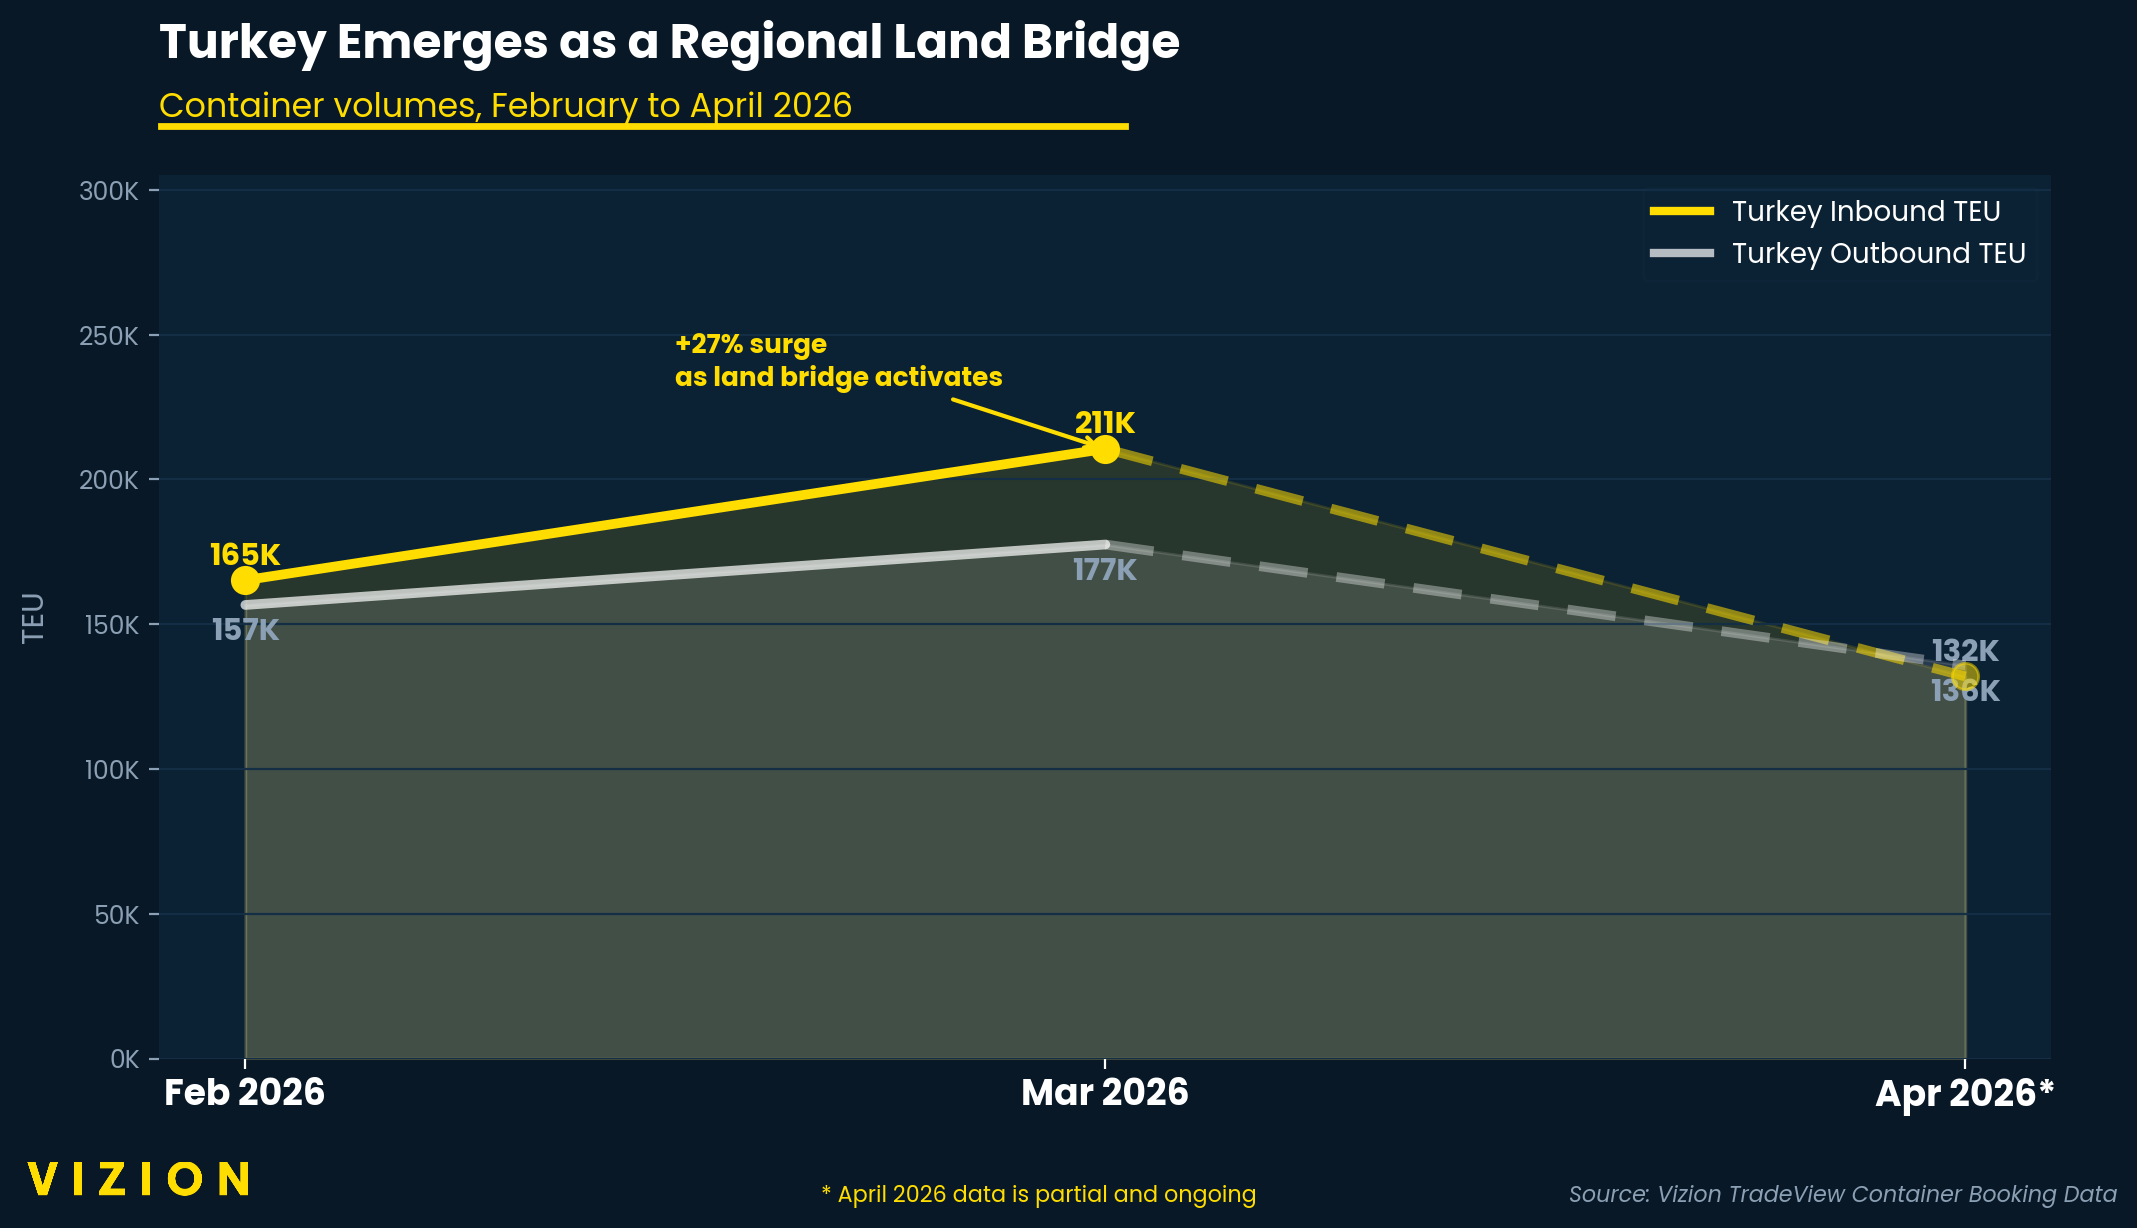
Our container booking data reflects this shift clearly. Turkey's inbound container volumes jumped approximately 27% from February to March 2026, rising from approximately 165,000 TEU to approximately 210,500 TEU — consistent with trade being rerouted through the country rather than through Gulf maritime lanes.
This is not the "reroute around Africa" story that defined the Bab el-Mandeb and Red Sea crisis in 2024. This is a multimodal rewrite: sea-to-land transfers at Jeddah, Oman, and Turkish ports, with highways and rail lines becoming critical links in global container flows in a way they have not been before.
What the Hormuz Disruption Means for Your Supply Chain
For risk teams, procurement leaders, and logistics operators, the Hormuz disruption carries several urgent lessons:
Chokepoint disruption is a step function, not a gradient. You don't get weeks of warning. You get a cliff in your data — and only teams with live, granular shipment visibility can see it forming.
The solution set is now multimodal. Single-origin, single-mode supply chains — particularly anything transiting Hormuz, Bab el-Mandeb, Malacca/Singapore, or the Taiwan Strait — are being repriced by boards in real time. Building redundancy across two to three origin countries per SKU, and across modes (sea, land, and rail), is no longer a theoretical best practice. It is table stakes.
Your public data feed is the last to know. When AIS coverage degrades, when satellite imagery is restricted, and when shadow fleets carry an unknown share of remaining volume, companies relying solely on third-party aggregated feeds are at a disadvantage. The companies better positioned right now are those with visibility into their own cargo — at the booking, departure, and arrival level.
See Your Chokepoint Exposure Before the Next Disruption
The Gulf crisis will not be the last chokepoint disruption of this decade. The Red Sea taught us that. Hormuz has confirmed it.
At Vizion, our TradeView platform gives supply chain teams live access to the container booking data that lets you see what is happening at origin — before it shows up as a missed shipment, a stockout, or a production halt.
If you want to understand your own chokepoint exposure — which lanes you are transiting, which origins you are concentrated in, and where your next disruption is most likely to form — we would like to show you what that looks like in your data.
Request a TradeView demo below:
Frequently Asked Questions
1.) What happened to Gulf container volumes after the Strait of Hormuz near-closure in 2026?
Vizion's TradeView container booking data shows Gulf outbound volumes collapsed sharply between February and March 2026. UAE volumes fell approximately 73.5%, Kuwait fell approximately 75.6%, and Qatar dropped approximately 60%. Through April 17 — the most recent data available at time of publication — volumes had not recovered. April figures represent only the first 17 days of the month and are not a full monthly comparison.
2.) Why did Oman's container volumes increase while the rest of the Gulf collapsed?
Oman's main container ports — Salalah and Sohar — are located on the Arabian Sea coast, outside the Strait of Hormuz. When the strait became unreliable for shipping, Oman became the only Gulf origin with direct ocean access unaffected by the disruption. Oman outbound volumes grew approximately 29% from February to March 2026 in Vizion's container booking data.
3.) How did the Strait of Hormuz disruption affect Turkey's container volumes?
Turkey emerged as a key overland land bridge for freight that could no longer move through Gulf maritime lanes. Vizion's container booking data shows Turkey's inbound volumes grew approximately 27% from February to March 2026, rising from approximately 165,000 TEU to approximately 210,500 TEU — consistent with significant trade diversion through Turkish ports including Mersin and Iskenderun.
4.) Why did traditional maritime data tools struggle during the Hormuz disruption?
Multiple layers of visibility appear to have degraded simultaneously. According to Kpler, AIS spoofing and dark-fleet activity had been rising significantly before the escalation. Planet Labs restricted satellite imagery of the region, as reported by Reuters and BBC. And trade manifests became less reliable as a growing share of active vessels were linked to sanctioned or shadow-fleet operators. The combination meant that shipment-level booking data — the kind Vizion tracks — became one of the more reliable signals available.
5.) What is a maritime chokepoint and why does it matter for supply chains?
A maritime chokepoint is a narrow waterway through which a disproportionate share of global trade passes. The Strait of Hormuz handles a significant share of global oil and LNG supply. The Strait of Malacca is one of the world's busiest trade corridors. When these points are disrupted, effects on supply chains are immediate — and companies with real-time visibility into their own shipments are better positioned to respond than those dependent on public data feeds alone.
6.) How can supply chain teams prepare for future chokepoint disruptions?
The clearest lessons from the 2026 Hormuz disruption are: diversify origins across two to three countries per product category, build multimodal redundancy across sea, land, and rail corridors, and invest in direct shipment-level data visibility rather than relying solely on aggregated public feeds. Vizion's TradeView platform provides the container booking data coverage needed to see your own exposure in real time.
%20-%202026-07-17T152701.754.png)
%20-%202026-07-17T104412.520.png)
%20-%202026-07-08T100322.158.png)


