

%20(92).png)
A Data-Driven Analysis of Quarterly Import Trends, Sectoral Collapse, and Strategic Implications for Supply Chain Leaders
By Kyle Henderson, CEO of VIZION API
Published: November 5, 2025
Executive Summary
Our comprehensive analysis of quarterly US import data reveals that 2025 has become a watershed year for American trade volumes, marking the most significant import contraction since the pandemic recovery. For the first time since March 2023, monthly import volumes are falling below the 2 million TEU threshold, signaling what freight industry experts now characterize as a "goods recession."
The data tells a stark story across major consumer categories:
- Furniture imports have collapsed by 26-33% quarterly, directly correlating with a frozen housing market where only 2.8% of homes are selling
- Solar equipment imports have plummeted 58-65% following escalating tariff policies
- Toy imports are down 30-35%, suggesting retailers anticipate the weakest holiday season in years
- Container shipping utilization has dropped from 100% to 91%, creating widespread overcapacity
- China-origin imports declined 22.9% year-over-year in September alone
This contraction represents a structural shift rather than temporary volatility, requiring fundamental adjustments in supply chain planning, port capacity management, and logistics network design. The implications extend far beyond trade statistics—they signal a broader transformation in American consumption patterns and global supply chain dynamics.
The Numbers Tell a Stark Story: 2025 Import Volumes
The September 2025 data from Descartes and the National Retail Federation provides unambiguous evidence of the import contraction. US seaports handled 2.31 million TEUs in September, representing an 8.4% year-over-year decline, despite being the third-highest September volume on record. This apparent contradiction underscores how dramatically the baseline has shifted—what would have been considered strong performance in previous years now represents significant weakness.
Q4 2025 Forecast (National Retail Federation):
- October: 1.97 million TEU (-12.3% YoY)
- November: 1.75 million TEU (-19.2% YoY)
- December: 1.72 million TEU (-19.4% YoY)
The full-year projection of 24.79 million TEU represents a 2.9% decline from 2024's 25.5 million TEU. More concerning is the accelerating nature of the decline—each subsequent month in Q4 shows deepening year-over-year contractions, suggesting momentum is building toward further weakness in 2026.

Monthly container imports averaged 2.35 million TEUs in 2024 and around 2.5 million TEUs in the first half of 2025, making the projected sub-2 million TEU months particularly striking. As Jonathan Gold, NRF's Vice President for Supply Chain and Customs Policy, noted, "This year's peak season has come and gone, largely due to retailers frontloading imports ahead of reciprocal tariffs taking effect."
Category-by-Category Breakdown: Winners and Losers
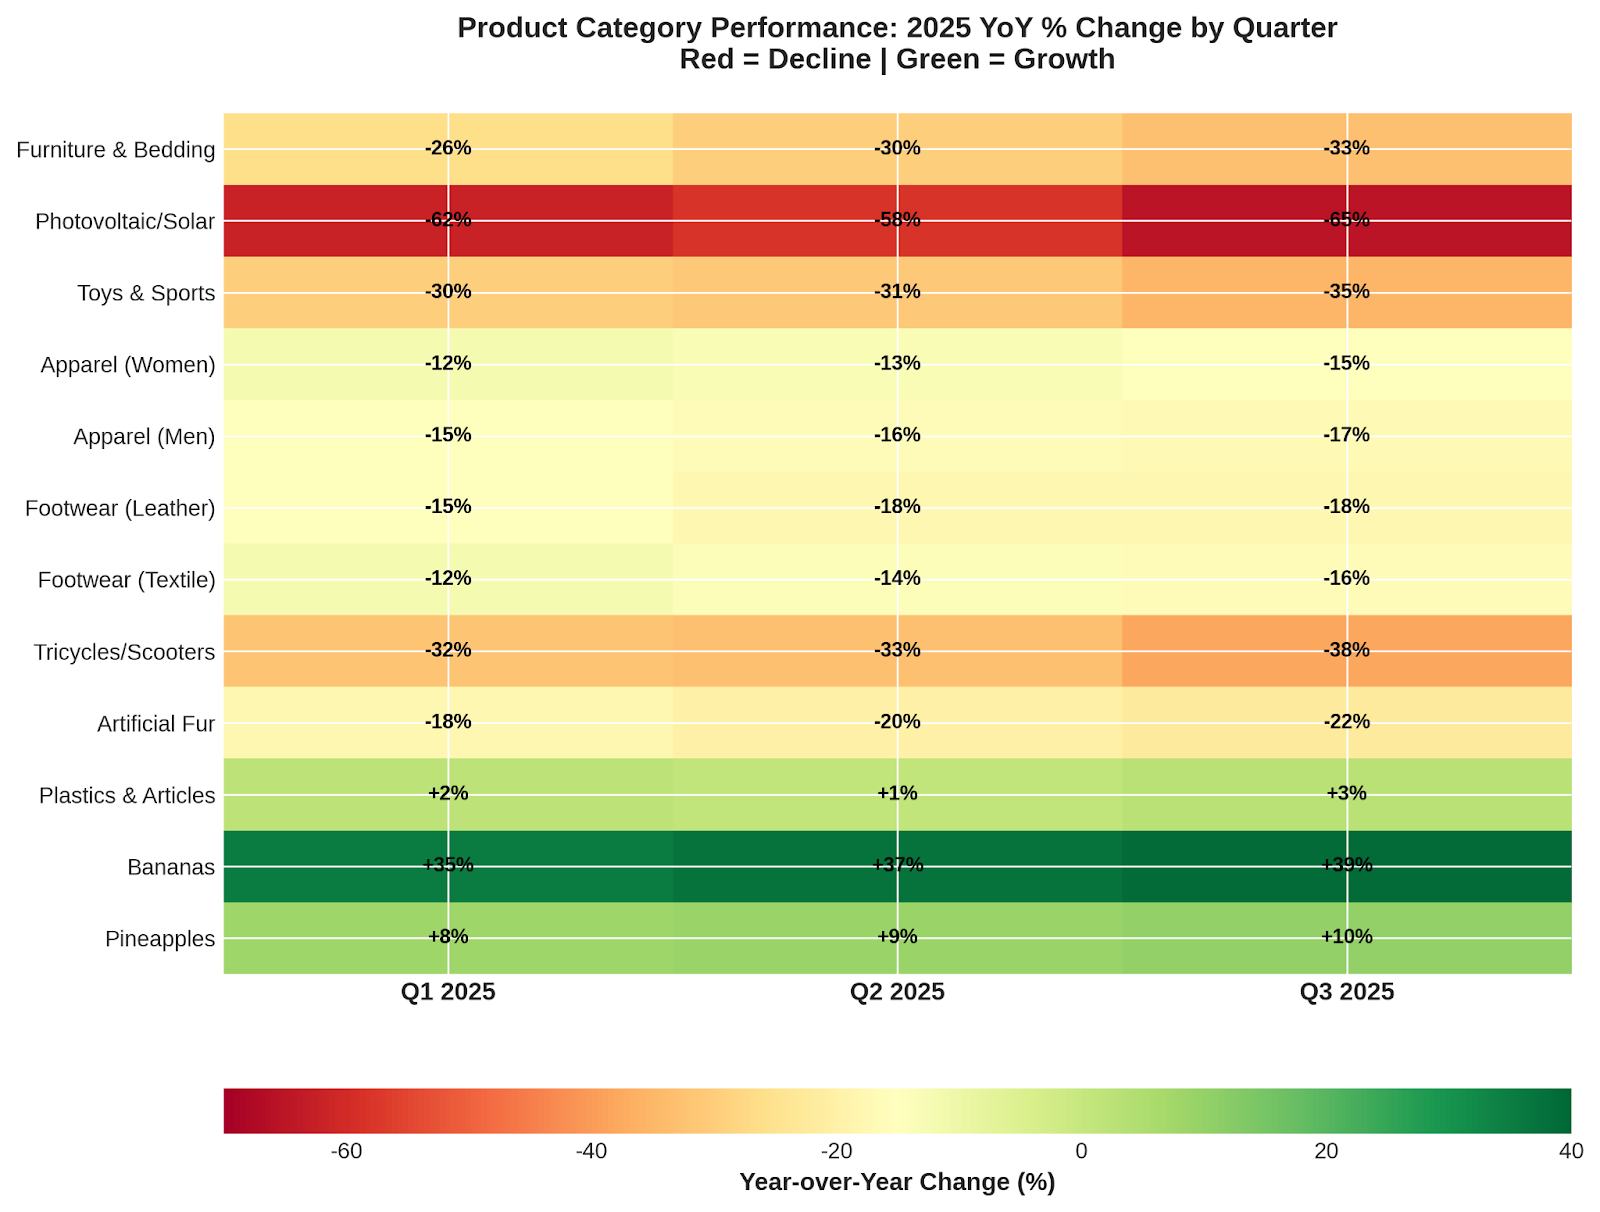
Our quarterly analysis reveals highly differentiated performance across product categories, with clear winners and losers emerging from the 2025 trade environment. The pattern suggests a fundamental shift in American consumption toward essential goods and away from discretionary purchases.
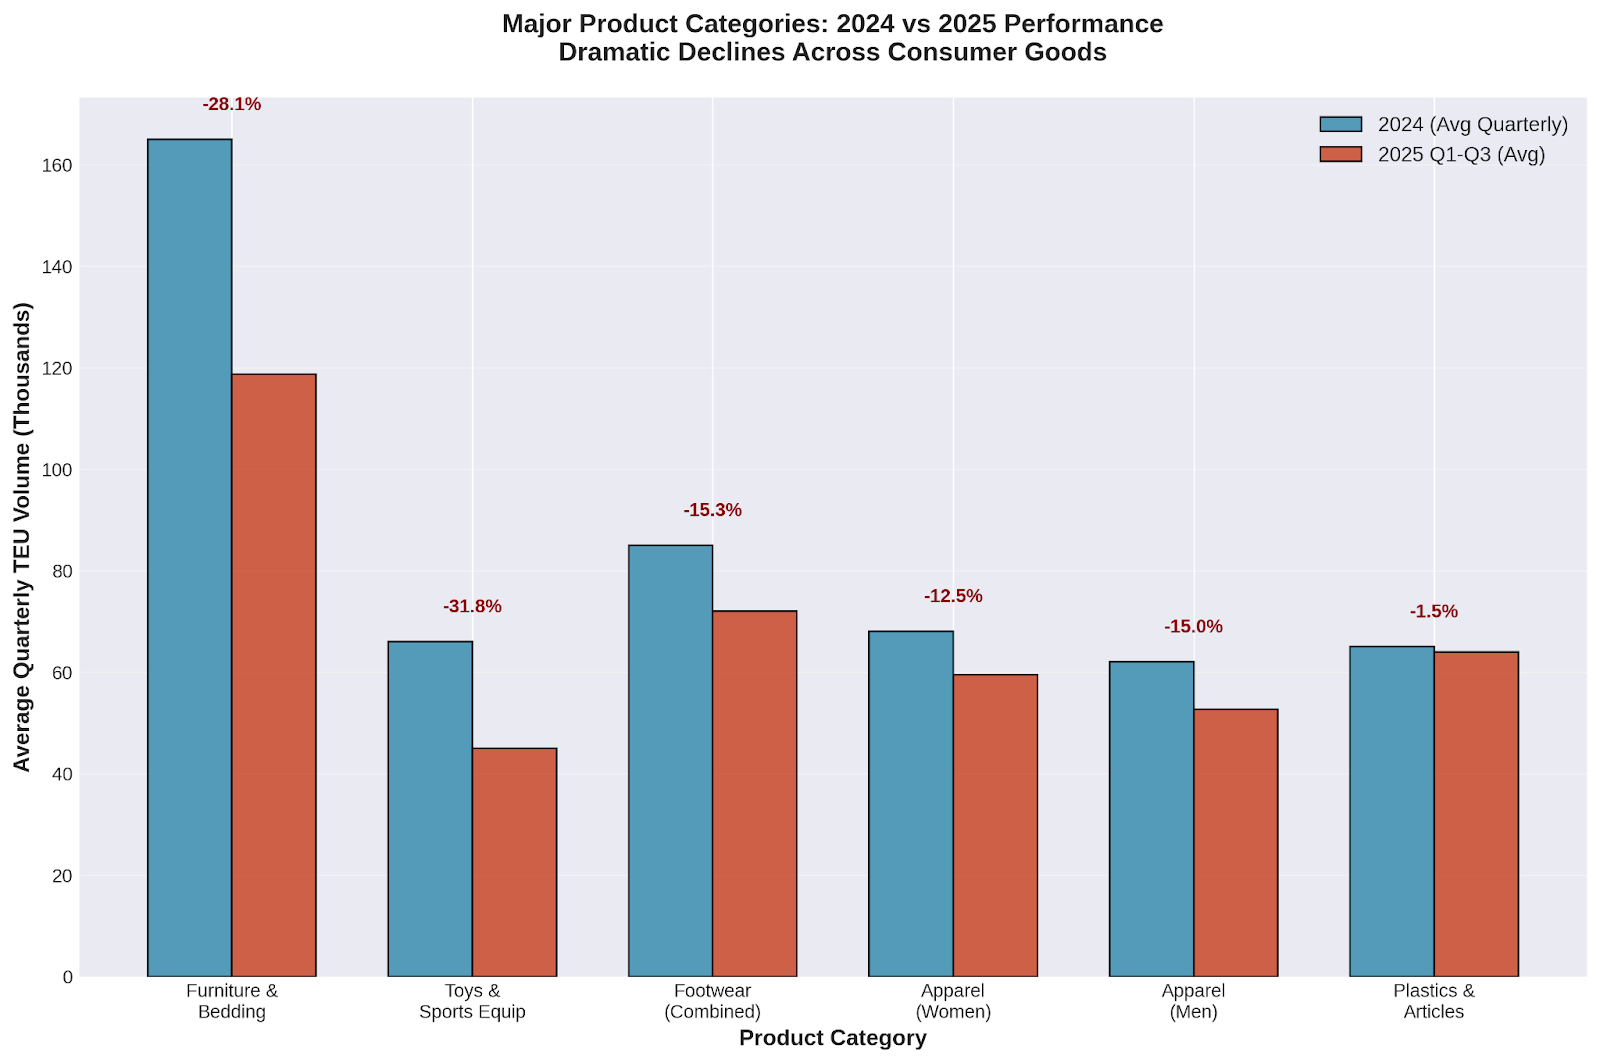
Major Declining Categories
- Furniture & Bedding represents the most severe decline, with quarterly contractions of 26% in Q1, 30% in Q2, and 33% in Q3. This sequential deterioration directly correlates with housing market conditions where mortgage rates hovering near 6-7% have created what economists describe as a "deep freeze."
- Apparel and Footwear categories show consistent 10-17% quarterly declines across men's, women's, and children's segments. Notably, retail footwear prices declined 1.6% in May 2025—the steepest drop in over four years—indicating oversupply conditions despite reduced import volumes.
- Electronics and Technology goods face dual pressures from tariff escalations and inventory corrections following the pandemic-era surge. Consumer electronics imports show particular weakness as discretionary spending shifts away from physical goods.
Resilient Categories
- Food and agricultural imports demonstrate remarkable stability, with bananas showing growth of approximately 37% and pineapples maintaining 9-12% increases across quarters. This resilience reflects the essential nature of food products and their relative insensitivity to discretionary spending fluctuations.
- Industrial plastics and basic manufacturing inputs show more modest declines, typically in the 2-5% range, suggesting that while consumer demand has weakened, underlying industrial activity maintains more stability.
The Furniture Mega-Collapse: A Housing Market Story
The furniture import collapse serves as perhaps the clearest indicator of broader economic stress, functioning as a leading indicator for consumer confidence and housing market health. Our data shows furniture imports declining not just year-over-year, but sequentially worsening each quarter within 2025 itself.
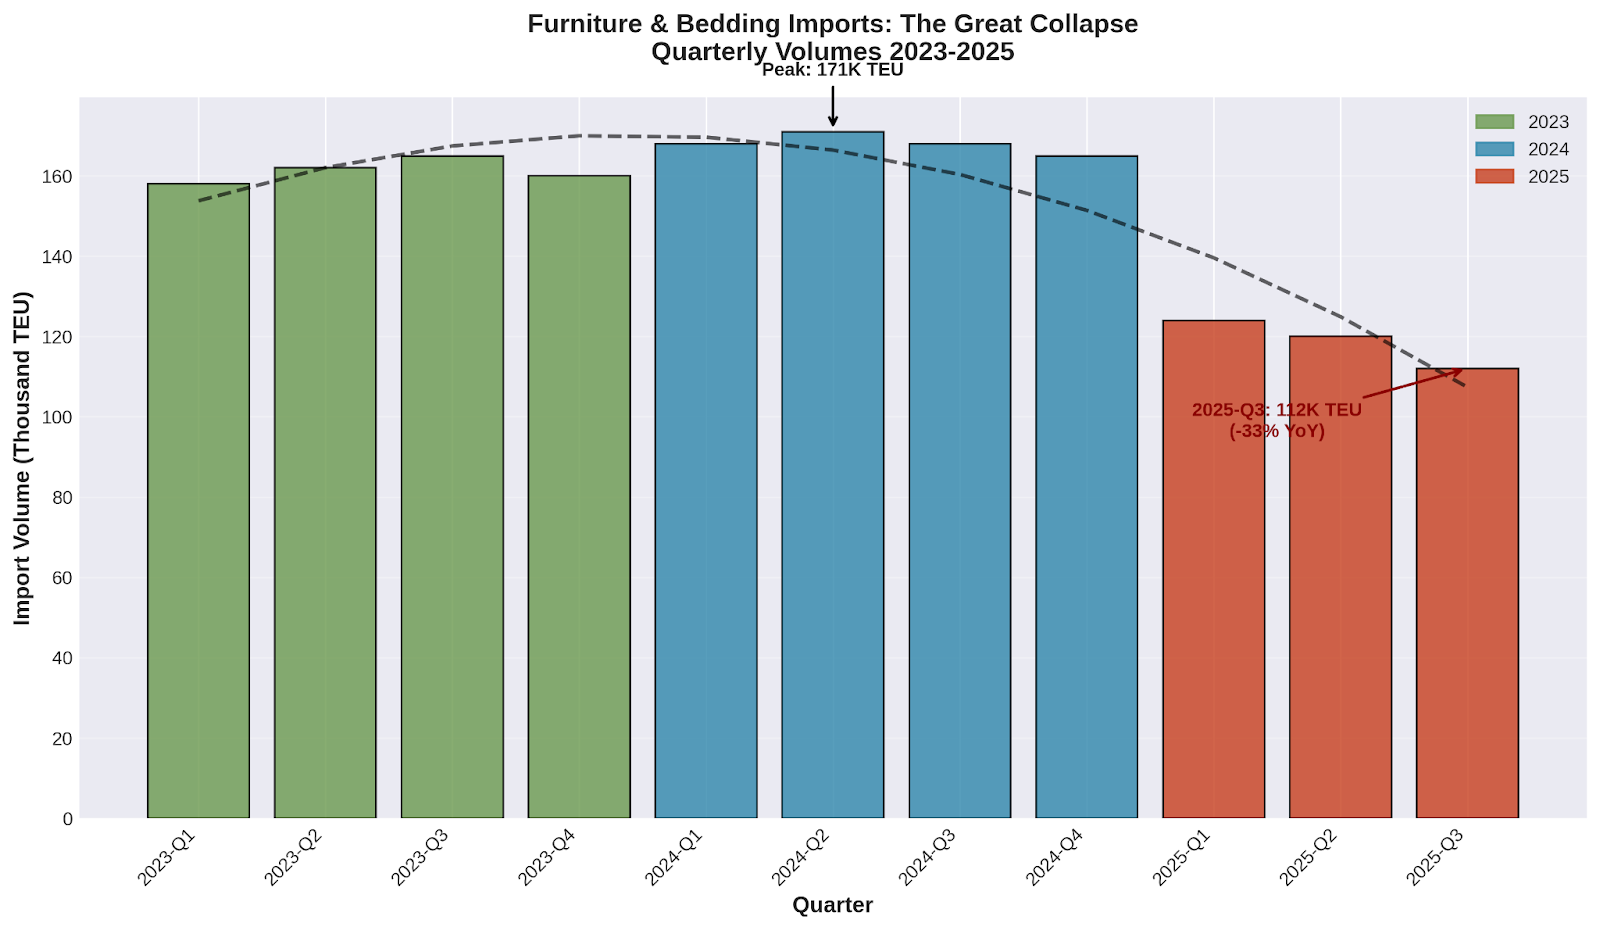
Furniture Import Quarterly Performance 2025:
- Q1: -26% vs Q1 2024
- Q2: -30% vs Q2 2024
- Q3: -33% vs Q3 2024
This pattern reflects what Katherine Black of Kearney identifies as the core driver: "The frozen housing market is probably the biggest factor dragging down furniture demand." With only 2.8% of homes selling in 2025, the traditional drivers of furniture purchases—new home buying, moving, and home improvement projects—have virtually disappeared.
The furniture industry's challenges extend beyond imports to domestic sales, with combined furniture, bedding, and accessories sales totaling $51.6 billion in 2024, down 8% from 2023's $56.1 billion and off nearly 15% from 2022's $60.6 billion peak. This sustained multi-year decline suggests structural rather than cyclical challenges.
For supply chain executives, the furniture collapse signals broader implications for housing-related logistics networks, warehouse capacity planning in major furniture distribution hubs, and container shipping routes that heavily service furniture imports from Asia.
Solar Equipment's Dramatic Reversal
Perhaps no category illustrates the impact of trade policy uncertainty more dramatically than photovoltaic and solar equipment imports. After experiencing growth throughout the energy transition period, solar equipment imports collapsed 58-65% across Q1-Q3 2025, representing one of the steepest sectoral declines in the dataset.
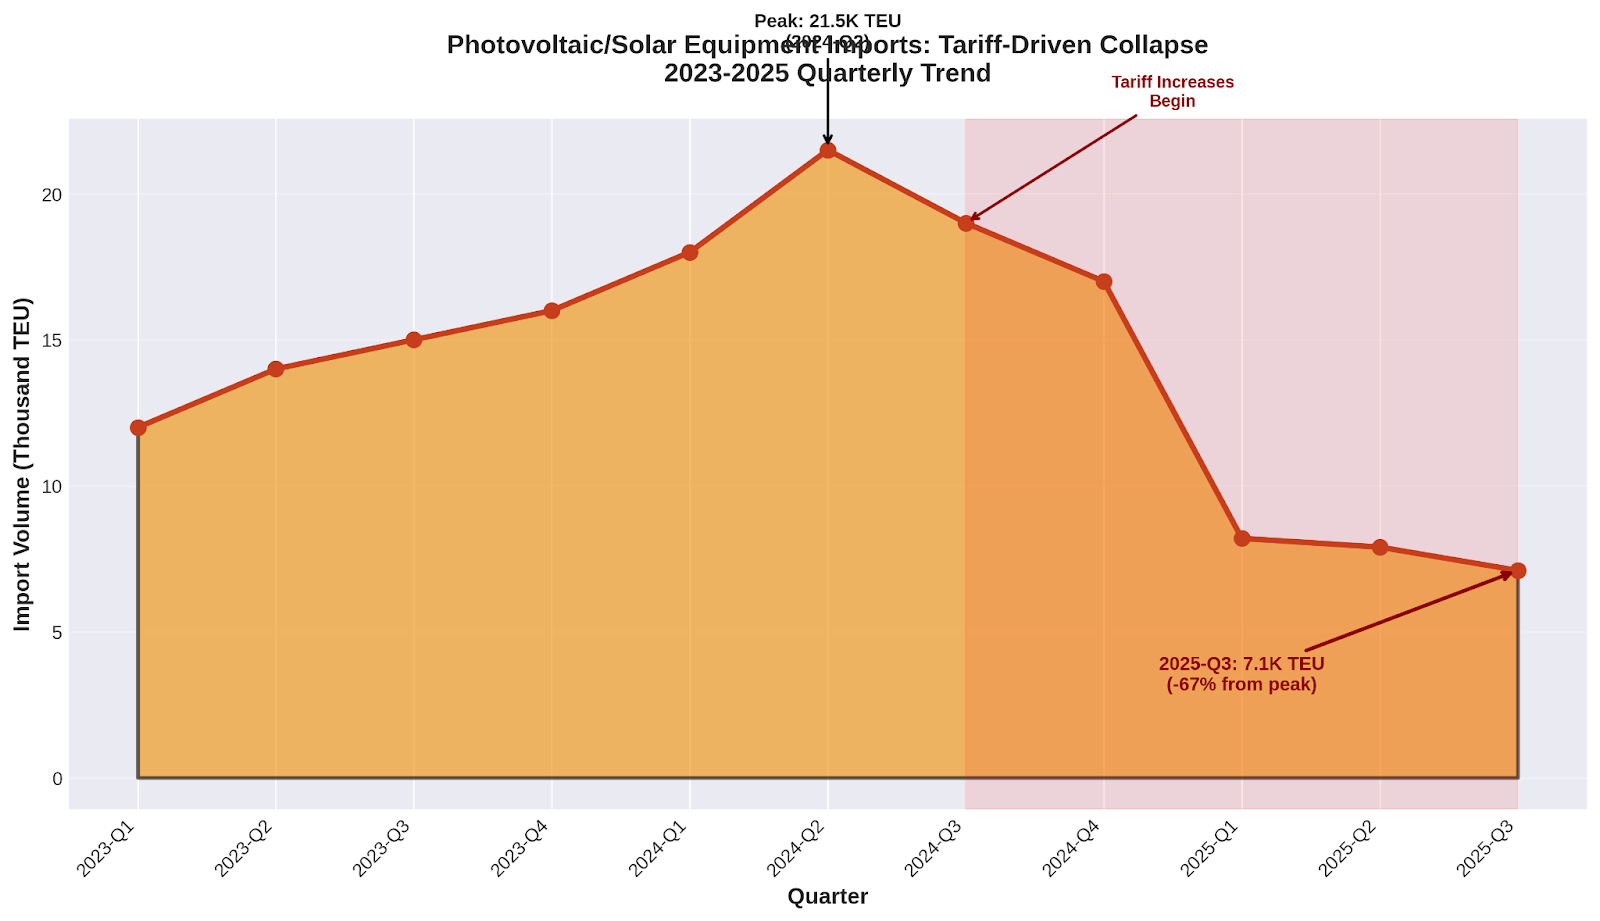
The reversal stems directly from escalating tariff policies. Biden administration increases raised tariffs on PV cells from 25% to 50% in 2024, while subsequent Trump administration policies imposed additional tariffs reaching up to 3,521% on some Southeast Asian solar imports. The Solar Energy Industries Association reports these policies have led to the loss of more than 62,000 U.S. jobs and $19 billion in new private sector investment.
The timing of the solar collapse—accelerating through each quarter rather than stabilizing—suggests that policy uncertainty itself has become as damaging as the tariffs themselves. Import volumes show no signs of bottoming out, indicating potential supply chain disruptions extending well into 2026.
For logistics planning, the solar equipment decline affects specialized transportation requirements, port facilities designed for oversized panels, and distribution networks serving renewable energy installation companies. The capacity previously dedicated to solar imports will require reallocation or face underutilization.
Seasonal Patterns Breaking Down: The Toy Import Warning
The toy import data provides crucial insights into both immediate holiday season prospects and broader consumer spending patterns. Traditional seasonal patterns—where Q3 imports surge 40-50% ahead of holiday inventory building—have largely collapsed in 2025.
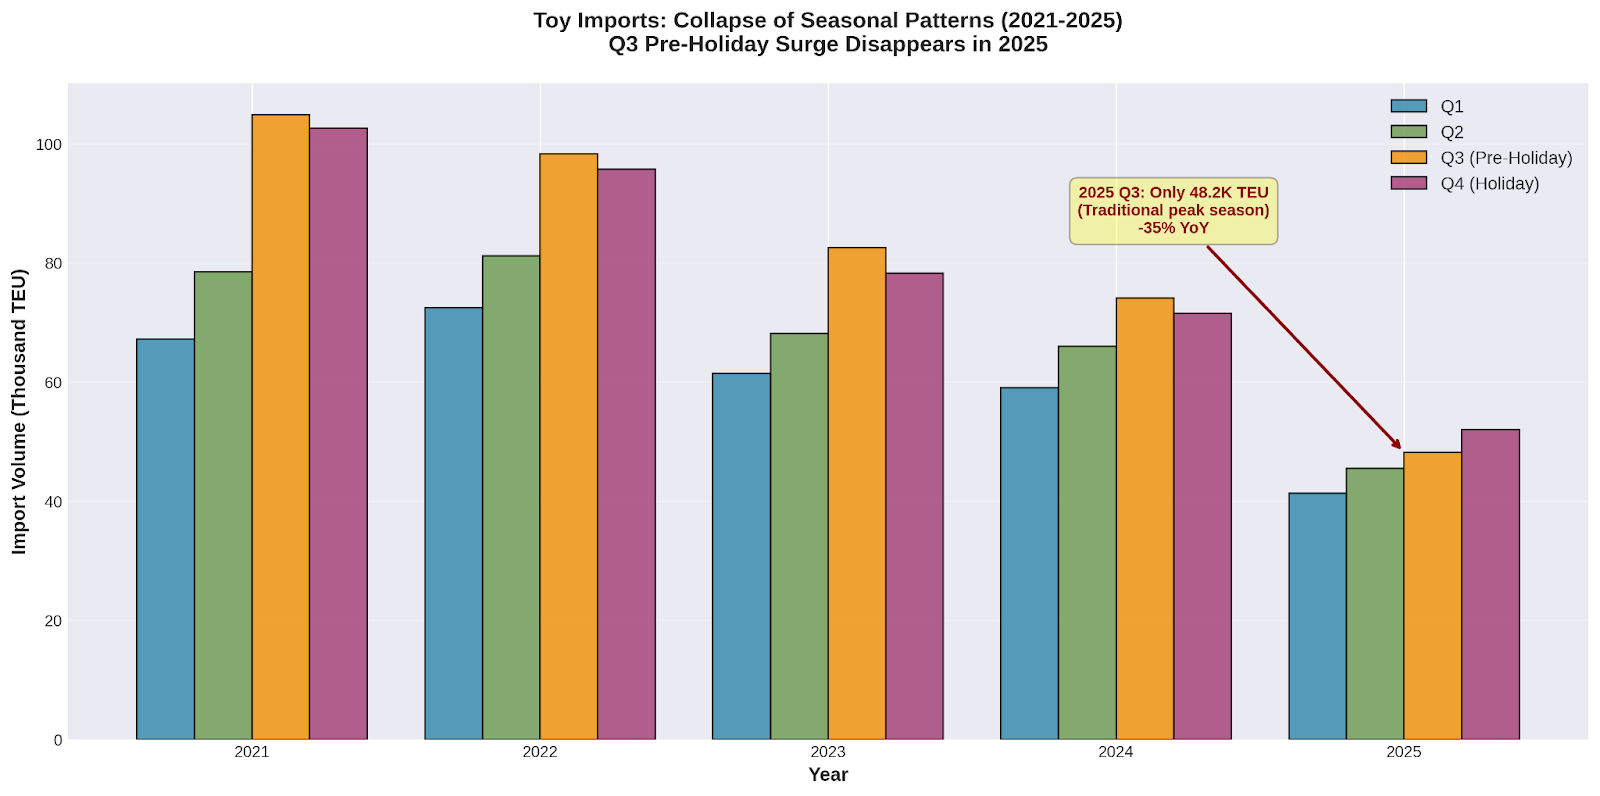
Toy Import Seasonal Pattern Breakdown:
- Historical Q3 surge: 40-56% vs Q1
- 2025 Q3 surge: Only 17% vs Q1 (weakest on record)
- Q3 2025 absolute decline: -35% vs Q3 2024
This pattern breakdown signals retail confidence at multi-year lows. With 77% of toys imported to the US and tariff rates reaching 20-22.4% by June 2025, retailers have front-loaded inventory where possible and dramatically reduced holiday season orders. The implication is clear: retailers anticipate the weakest holiday season in years.
The toy import warning extends beyond seasonal sales to broader supply chain dynamics. Traditional peak season logistics planning—additional warehouse capacity, seasonal labor hiring, transportation surge pricing—may see significant reductions in Q4 2025 and beyond.
What's Driving the Decline: Tariffs, Housing, and Consumer Sentiment
The import contraction results from the convergence of multiple economic forces, creating what economists describe as a "perfect storm" for trade volumes. Understanding these drivers is crucial for strategic planning and scenario development.
Tariff Escalation
Average US tariff rates rose from 2.5% in January to 27% by mid-2025—the highest level in more than a century. This dramatic escalation affects not just the targeted products but creates uncertainty that dampens import planning across all categories. Ben Hackett of Hackett Associates notes that "ongoing volatility in U.S. tariff policy is creating significant economic uncertainty."
Housing Market Freeze
With mortgage rates near 6-7% and home affordability at multi-decade lows, housing market activity has essentially frozen. This affects not only furniture imports but appliances, home improvement goods, and the broader ecosystem of housing-related consumption that drives significant import volumes.
Consumer Sentiment Deterioration
Deloitte's consumer research shows 57% of US consumers expect the economy to weaken in the year ahead—the most negative outlook in recent surveys. This sentiment translates directly into deferred discretionary purchases, affecting imports across multiple categories. Lower-income consumers face particular pressure, with earnings reports indicating growing economic stress at the household level.
Retail Sector Contraction
The structural challenges facing retail are evident in store closure data: approximately 6,000 stores closed in the first half of 2025, vacating 123.7 million square feet of retail space, while only 3,960 new stores opened. This physical retail contraction directly impacts import demand patterns and distribution network requirements.
Port and Logistics Implications: The Overcapacity Challenge
The import contraction creates significant challenges across the logistics ecosystem, from port operations to container fleet management. These challenges require proactive management to avoid operational and financial stress.
Port Capacity Utilization
Major US ports are experiencing the first sustained period of underutilization since the pandemic recovery. With monthly volumes projected below 2 million TEU for Q4 2025, port capacity utilization rates are falling to levels that challenge operational efficiency and financial sustainability.
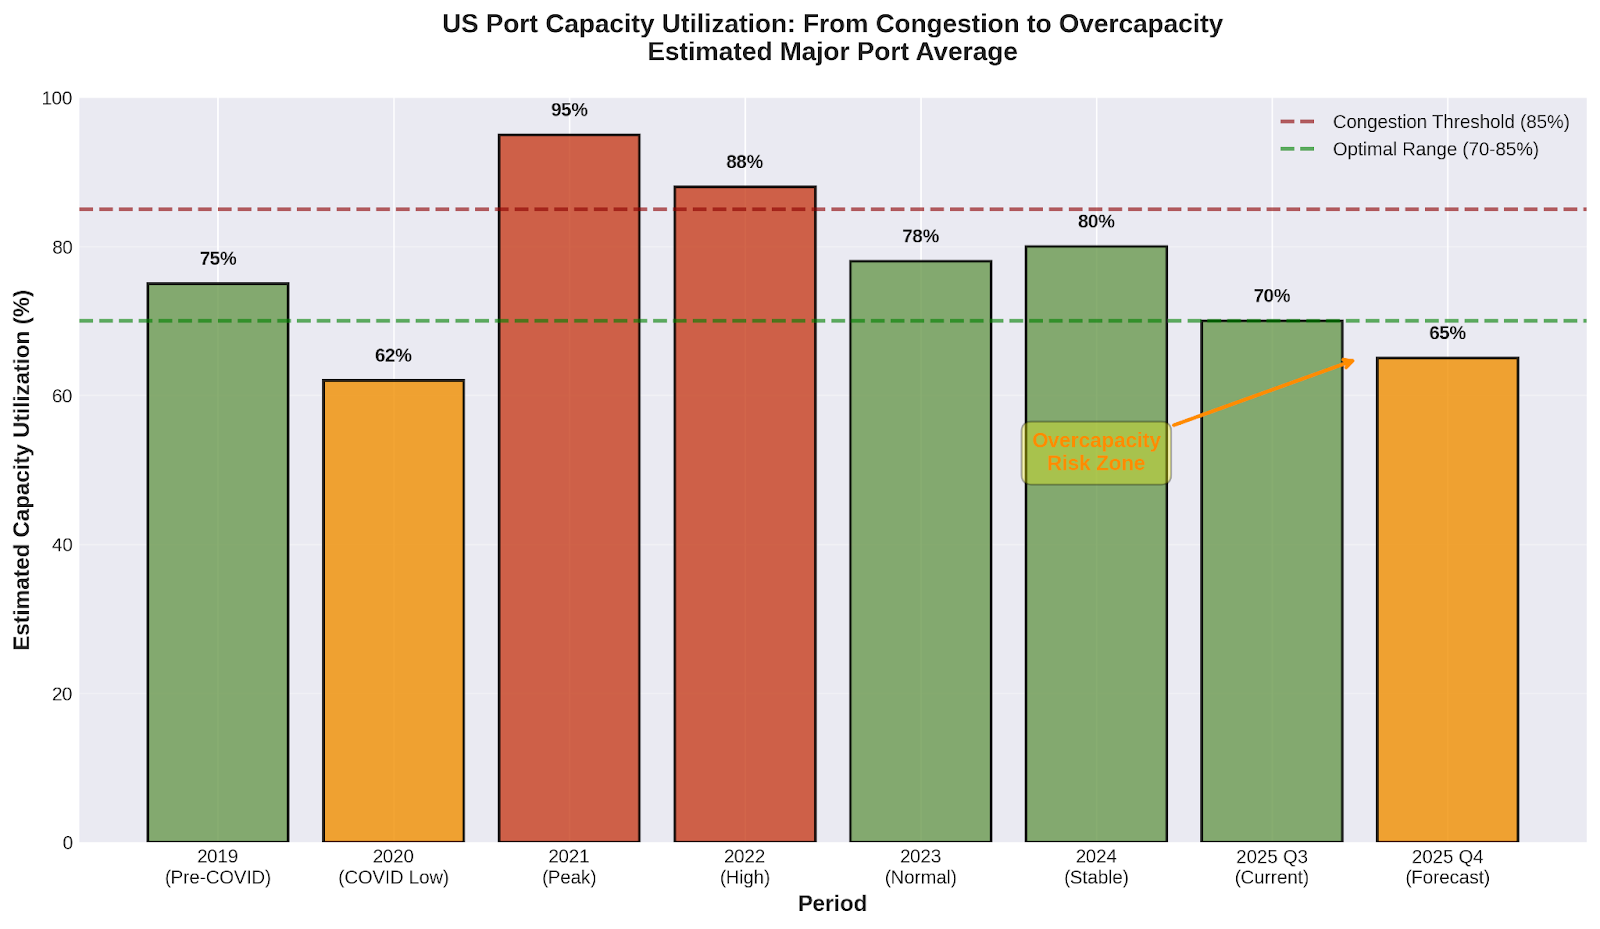
Container Shipping Capacity Metrics:
- Vessel utilization: 100% → 91% year-over-year
- Freight rates: $1,669 per FEU (2-year lows)
- Drewry Contract Rate Index: -3% YoY (first decline since July 2024)
The container shipping industry faces what Seatrade Maritime characterizes as "a decade of overcapacity," with approximately 1 million TEU in excess capacity expected to enter the market. This overcapacity environment creates downward pressure on rates but also forces operational adjustments across the logistics network.
Warehouse and Distribution Implications
Reduced import volumes translate directly into lower warehouse utilization, particularly in consumer goods categories. Furniture warehousing, which typically requires significant space for bulky goods, faces particular challenges with demand down 26-33%. Electronics and apparel distribution centers similarly must adjust capacity expectations.
Labor Force Adjustments
FreightWaves reports that truck driver employment has reverted to pre-pandemic levels around 1.523 million, while the Outbound Tender Volume Index has fallen 18% year-over-year. This "goods recession" requires careful workforce planning to balance reduced volumes with maintaining operational capability for eventual recovery.
Looking Ahead: 2026 Scenarios and Strategic Planning
The critical question facing supply chain executives is whether the 2025 import contraction represents a temporary adjustment or the beginning of a structural shift in American trade patterns. Our analysis suggests three potential scenarios for 2026 planning.
Scenario 1: Cyclical Recovery (30% probability)
In this scenario, Q4 2025 data shows stabilization rather than continued deterioration, consumer sentiment improves with resolution of policy uncertainties, and housing market activity begins to recover with lower interest rates. Import volumes would recover to 2024 levels by late 2026.
Scenario 2: Extended Weakness (50% probability)
This scenario assumes continued policy uncertainty, housing market weakness extending through 2026, and consumer spending patterns that permanently shift toward services and away from goods. Import volumes would remain 15-20% below 2024 levels throughout 2026.
Scenario 3: Structural Transformation (20% probability)
The most dramatic scenario involves fundamental changes in American consumption patterns, nearshoring initiatives that reduce import dependence, and permanent shifts in trade relationships. This would result in import volumes 25-30% below historical peaks and require complete supply chain network redesign.
Strategic Planning Implications
Regardless of scenario, supply chain executives should prepare for:
- Flexible Capacity Management: Develop systems to scale operations up or down rapidly based on actual demand rather than historical patterns
- Diversified Revenue Streams: Reduce dependence on traditional import-export operations through domestic logistics and value-added services
- Enhanced Visibility: Invest in real-time tracking and analytics capabilities to respond quickly to changing trade patterns
- Cost Structure Optimization: Prepare for sustained periods of lower volumes while maintaining service capabilities
- Alternative Market Development: Explore opportunities in domestic freight, nearshoring logistics, and emerging trade corridors
Conclusion: Navigating the New Normal
The 2025 import contraction represents more than statistical variance—it signals the emergence of a fundamentally different operating environment for American supply chains. The convergence of tariff policies, housing market dynamics, consumer sentiment shifts, and structural retail changes has created conditions that require strategic rather than tactical responses.
The quarterly data progression through 2025 shows accelerating rather than stabilizing declines, suggesting that Q4 2025 will be critical for determining whether this represents temporary adjustment or permanent transformation. With furniture imports down 33% in Q3, toy imports signaling weak holiday prospects, and solar equipment collapsing amid policy uncertainty, the evidence points toward structural rather than cyclical challenges.
For supply chain executives, success in this environment requires acknowledging that historical patterns may no longer provide reliable guidance. The "goods recession" identified by freight industry analysts demands fundamental adjustments in capacity planning, network design, and operational strategies. Organizations that adapt quickly to this new reality will emerge stronger, while those that expect a return to 2021-2022 volume levels may find themselves with stranded assets and obsolete strategies.
The key lies in maintaining operational flexibility while building enhanced visibility into actual trade flows. As import patterns continue to evolve, real-time data and predictive analytics become essential tools for navigating uncertainty and identifying emerging opportunities within the broader challenge.
Navigate Trade Volatility with Enhanced Visibility
In an era of unprecedented import volatility, supply chain leaders need real-time visibility into container movements and trade patterns.
VIZION’s comprehensive container tracking platform provides the data intelligence required to navigate the evolving trade environment. Our solutions enable proactive decision-making through:
- Real-time container tracking across all major carriers
- Predictive analytics for arrival planning and capacity management
- Trade lane visibility for route optimization
- Exception management for proactive issue resolution
- API integration for seamless data flow into existing systems
Contact our team today to learn how VIZION can help your organization adapt to the new dynamics of global trade.
For more insights on supply chain technology and trade analytics, visit vizionapi.com
%20-%202026-07-17T152701.754.png)
%20-%202026-07-17T104412.520.png)
%20-%202026-07-08T100322.158.png)


