

%20-%202025-12-03T102412.000.png)
A Data-Driven Analysis of German Trade Trends, Industrial Challenges, and the Path Forward for Europe's Economic Engine
By Kyle Henderson, CEO of VIZION API
Published: December 3, 2025
Executive Summary
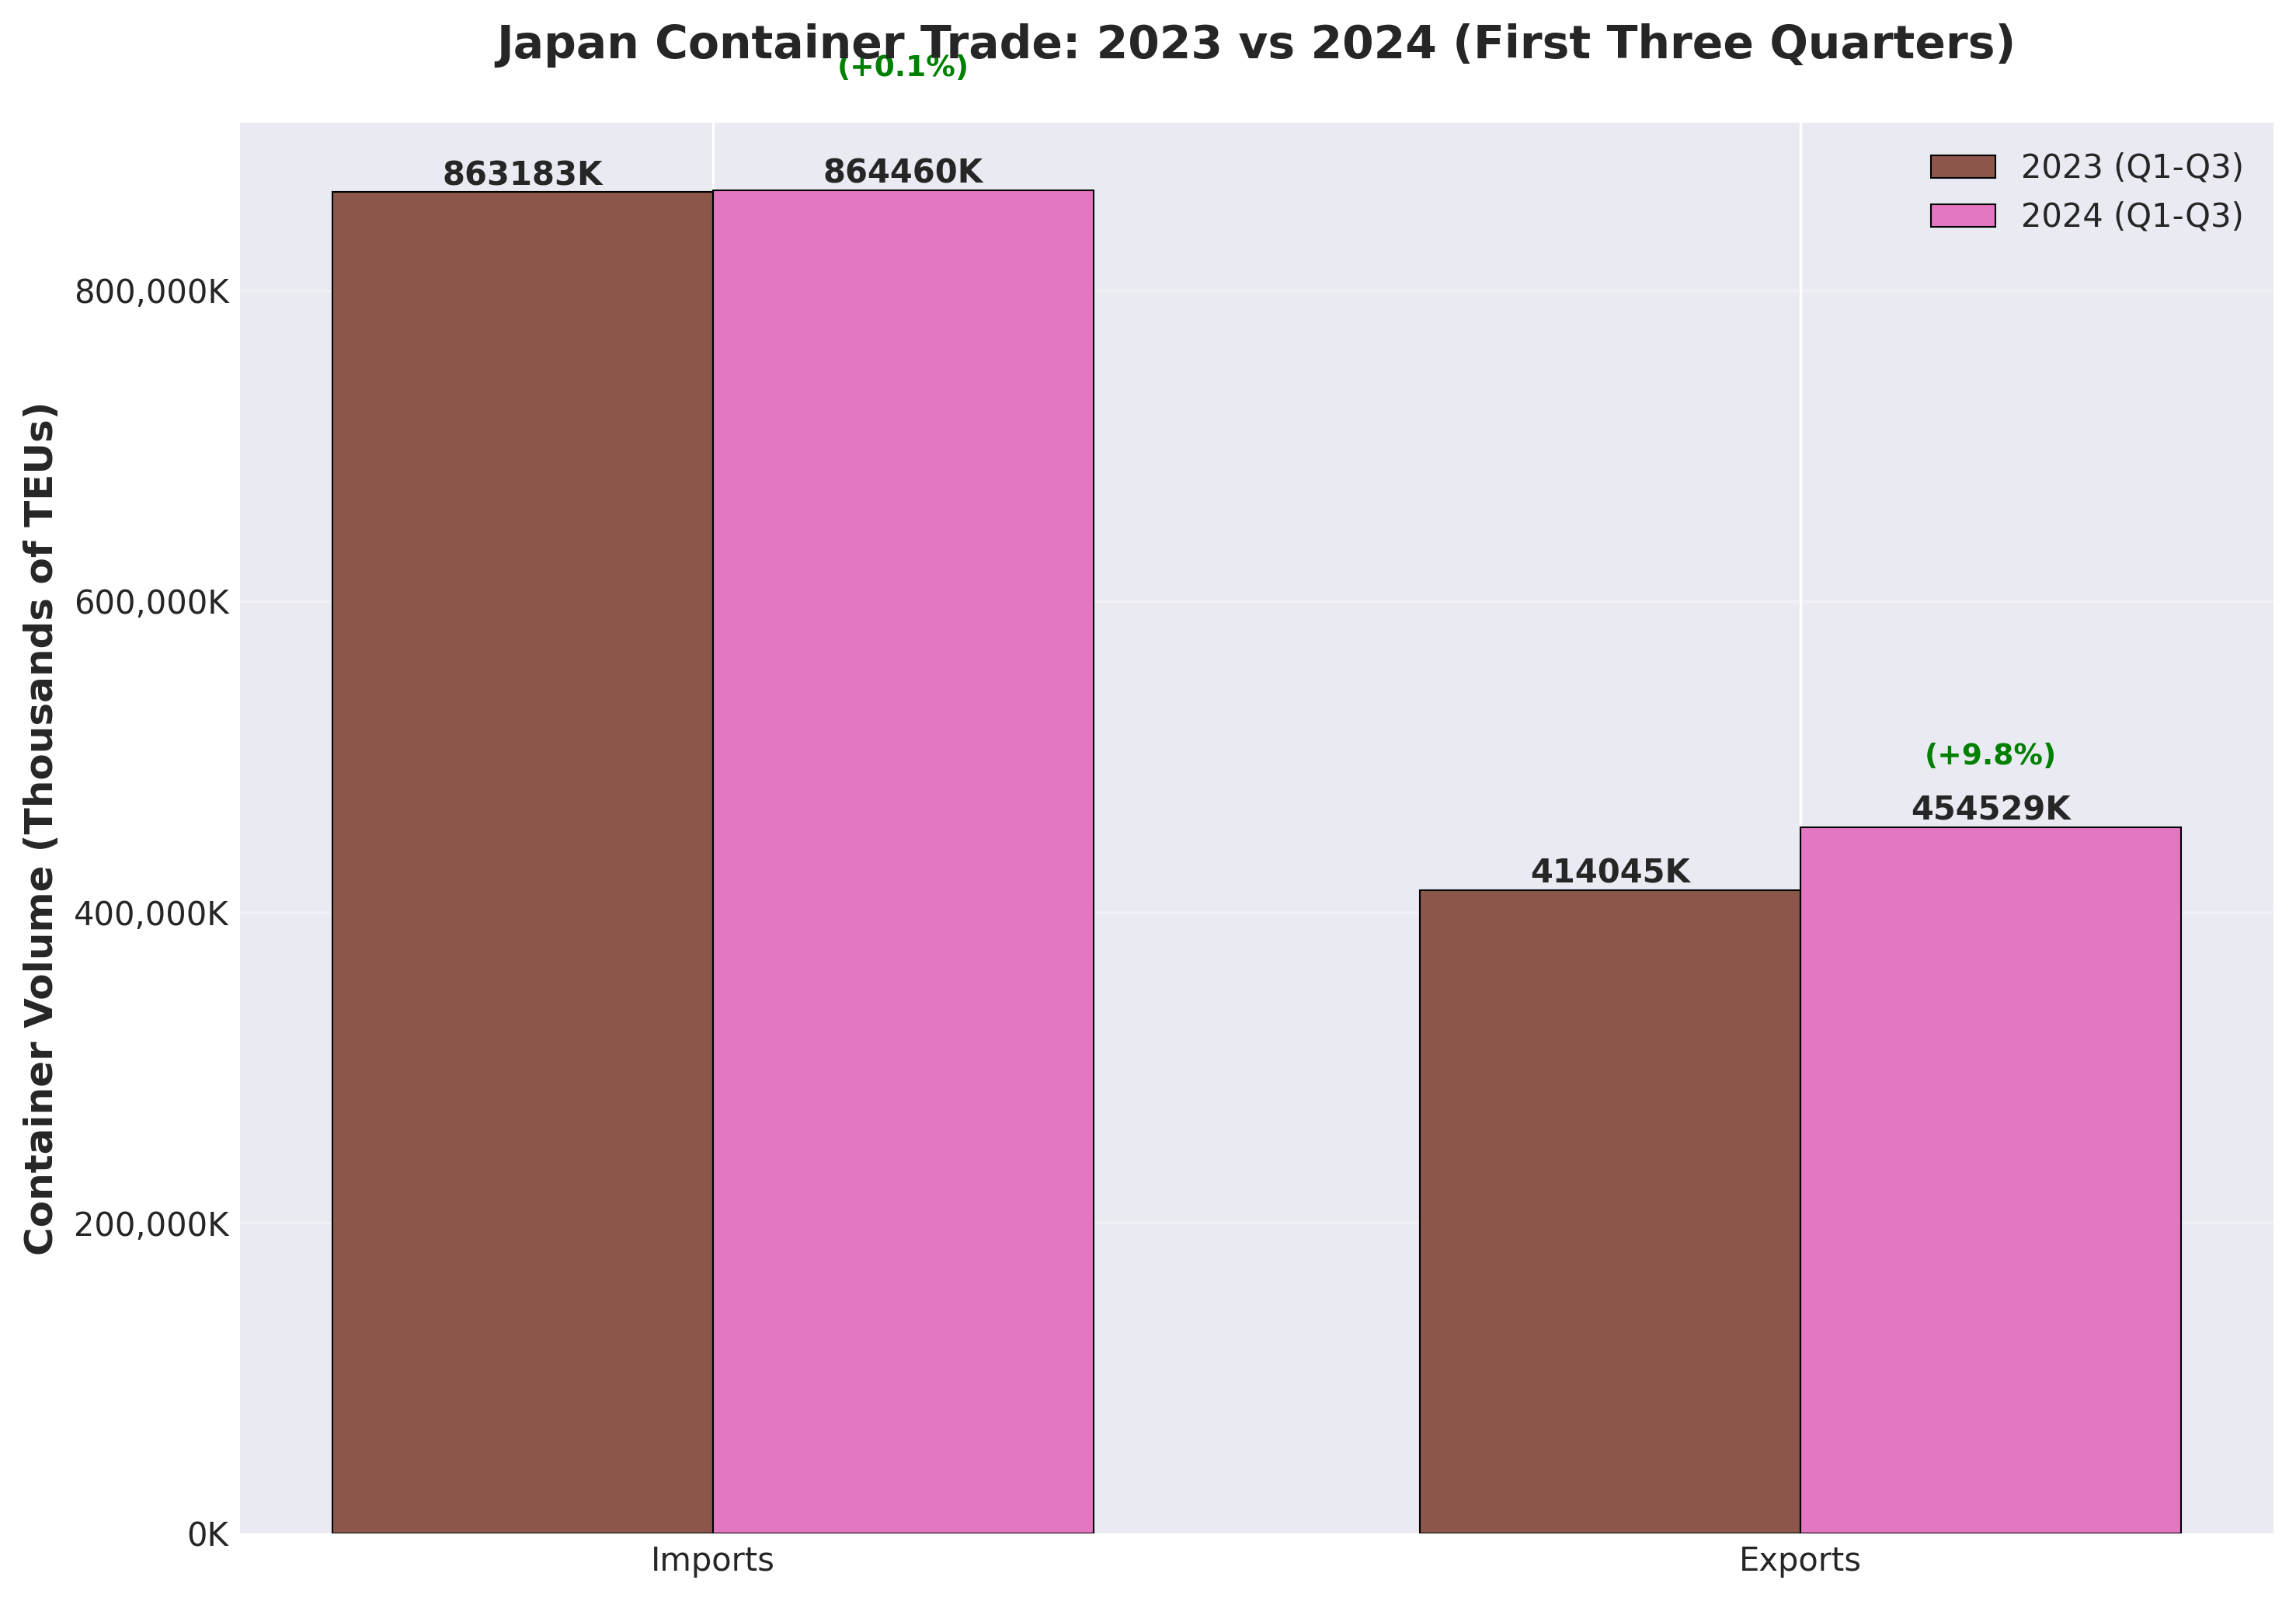
Japan's container trade in 2024 reveals a nation navigating complex economic crosscurrents: robust export growth driven by automotive and semiconductor manufacturing sectors confronting persistent structural trade imbalances. Analysis of VIZION ocean booking data covering 5,072 import HS codes and 3,709 export HS codes demonstrates that while Japan exported 605,784 TEUs of containers in 2024 (up 7.3% from 2023), imports reached 1.15 million TEUs (up 1.2%), resulting in a trade balance deficit of 540,432 TEUs—equivalent to importing 1.89 containers for every one exported.
This container-based analysis complements official Japanese Ministry of Finance statistics showing Japan's 2024 calendar year trade deficit of ¥5.5 trillion ($36.8 billion), marking the fourth consecutive year of overall trade deficits for the world's fourth-largest economy. However, crucially, this represents a 44% reduction from 2023's deficit, suggesting gradual improvement in Japan's trade position despite ongoing structural challenges.
The data reveals Japan's export sector demonstrated remarkable resilience despite global headwinds, with total exports reaching a record ¥107.1 trillion in 2024 (up 6.2% year-on-year)—the highest value since comparable statistics began in 1979. This export strength was driven by three primary factors: surging demand for Japanese semiconductor manufacturing equipment (particularly to China), sustained automotive exports despite production challenges, and the beneficial effects of yen depreciation which made Japanese goods more competitive internationally.
Container-level import analysis shows more modest growth at 1.2% for 2024, reflecting Japan's ongoing efforts to reduce energy dependence following the 2022-2023 energy crisis. The import moderation—particularly in categories like soybeans (HS 1201, -12,577 TEUs, -58.6%), beverages (HS 220299, -5,433 TEUs, -22.7%), and motor vehicles (HS 87, -5,036 TEUs, -36.9%)—suggests both demand-side weakness in the domestic economy and successful supply chain adjustments.
**Methodological Note:** This analysis examines ocean container volumes measured in Twenty-foot Equivalent Units (TEUs), which provides insights into the physical flow of goods but differs from value-based trade statistics. A single high-value semiconductor shipment occupies far fewer containers than equivalent-value bulk commodities. Therefore, container data illuminates logistics patterns and manufacturing activity but should be interpreted alongside official customs value statistics for comprehensive trade assessment.
The container data analyzed herein represents actual ocean bookings processed through VIZION's API platform, capturing real-time visibility into Japan's maritime trade flows across eight years (2017 Q4 through 2024 Q3). This granular, HS code-level data enables identification of specific product categories driving trade dynamics—from automobiles (HS 870323, +13,180 TEUs export growth) to semiconductor equipment components showing exceptional demand from Chinese manufacturers.
Japan's 2024 Trade Position in Context - Record Exports Meet Persistent Deficits
Japan's 2024 trade performance presents a paradox: record-breaking export values coexisting with continued structural trade deficits. According to Japanese Ministry of Finance customs statistics, Japan's total exports for calendar year 2024 reached ¥107.1 trillion, increasing 6.2% from 2023 and representing the highest export value in the 45-year history of comparable statistics. Yet despite this export surge, Japan recorded its fourth consecutive annual trade deficit at ¥5.5 trillion.
This apparent contradiction resolves when examining the composition of Japan's imports. While import volumes grew modestly (1.2% in container terms according to VIZION data), import values remained elevated due to the weak yen's impact on commodity prices. Japan's energy import dependency—despite reduced volumes following the 2022-2023 crisis—continues to generate substantial import costs when priced in depreciated yen.
The VIZION container data provides complementary perspective: Japan's Q3 2024 container imports totaled 297,645 TEUs (up 1.4% year-on-year), while exports reached 153,109 TEUs (up 4.4%). The 1.94:1 import-to-export ratio in Q3 2024 represents slight improvement from the 2.02:1 ratio in Q3 2023, suggesting gradual rebalancing but persistent structural deficit.
Bilateral Trade Relationships Define Japan's Position
Japan-China Trade Dynamics (2024):
Japan's 2024 trade performance was heavily influenced by its relationships with its two largest trading partners: China and the United States. Total bilateral trade between Japan and China reached $292.6 billion in 2024, with China remaining Japan's largest overall trading partner. However, the relationship showed signs of stress:
- Japan's exports to China: $124.6 billion, representing 17.6% of total Japanese exports
- Japan's imports from China: $168.1 billion, representing 22.5% of total Japanese imports
- Bilateral deficit: $43.5 billion, though this declined 3.3% from 2023 (¥6.4 trillion in yen terms)
The Japan-China trade relationship in 2024 was characterized by strong Japanese semiconductor equipment exports to China (driven by China's domestic chip manufacturing push) offset by continued Japanese imports of electronics, textiles, and consumer goods. Geopolitical tensions and supply chain diversification efforts remained persistent themes, though economic interdependence proved resilient.
Japan-United States Trade Relationship (2024):
Japan maintained a substantial trade surplus with the United States:
- Japan's exports to U.S.: $80.0 billion (up 4.2% from 2023)
- Japan's imports from U.S.: $79.0 billion
- Bilateral surplus: ¥8.6 trillion (approximately $57.4 billion), down 0.9% from 2023
The U.S. market absorbed significant Japanese automotive exports, with vehicles and vehicle parts accounting for over 30% of Japan's shipments to America. This surplus came under scrutiny in 2025 U.S. trade negotiations, though 2024 trade flows remained robust.
Four Years of Deficits: Structural Factors
Japan's string of four consecutive annual trade deficits (2021-2024) represents a departure from its historical position as a trade surplus nation. Several structural factors underpin this shift:
- Energy Import Dependency: Japan imports approximately 90% of its energy needs. The 2022-2023 energy crisis dramatically elevated import costs, and while prices moderated in 2024, the weak yen kept import values elevated.
- Offshore Manufacturing Migration: Japanese manufacturers have increasingly shifted production overseas (particularly to ASEAN nations), reducing exports while increasing imports of components and finished goods from Japanese-owned foreign factories.
- Demographic Headwinds: Japan's aging population and declining workforce constrain domestic production capacity and consumption, affecting both export capabilities and import demand.
- Yen Depreciation Asymmetry: While a weaker yen theoretically benefits export competitiveness, many Japanese exports are priced in foreign currency based on global market rates, limiting the price advantage. Meanwhile, commodity imports priced in dollars become more expensive in yen terms.
Despite these challenges, the 44% reduction in Japan's trade deficit from 2023 to 2024 (from ¥9.8 trillion to ¥5.5 trillion) signals that structural adjustments are beginning to yield results. Container-level data suggests export volumes are growing faster than import volumes, indicating potential for further rebalancing in 2025-2026.
Container Volume Trends: Eight-Year Analysis (2017-2024)
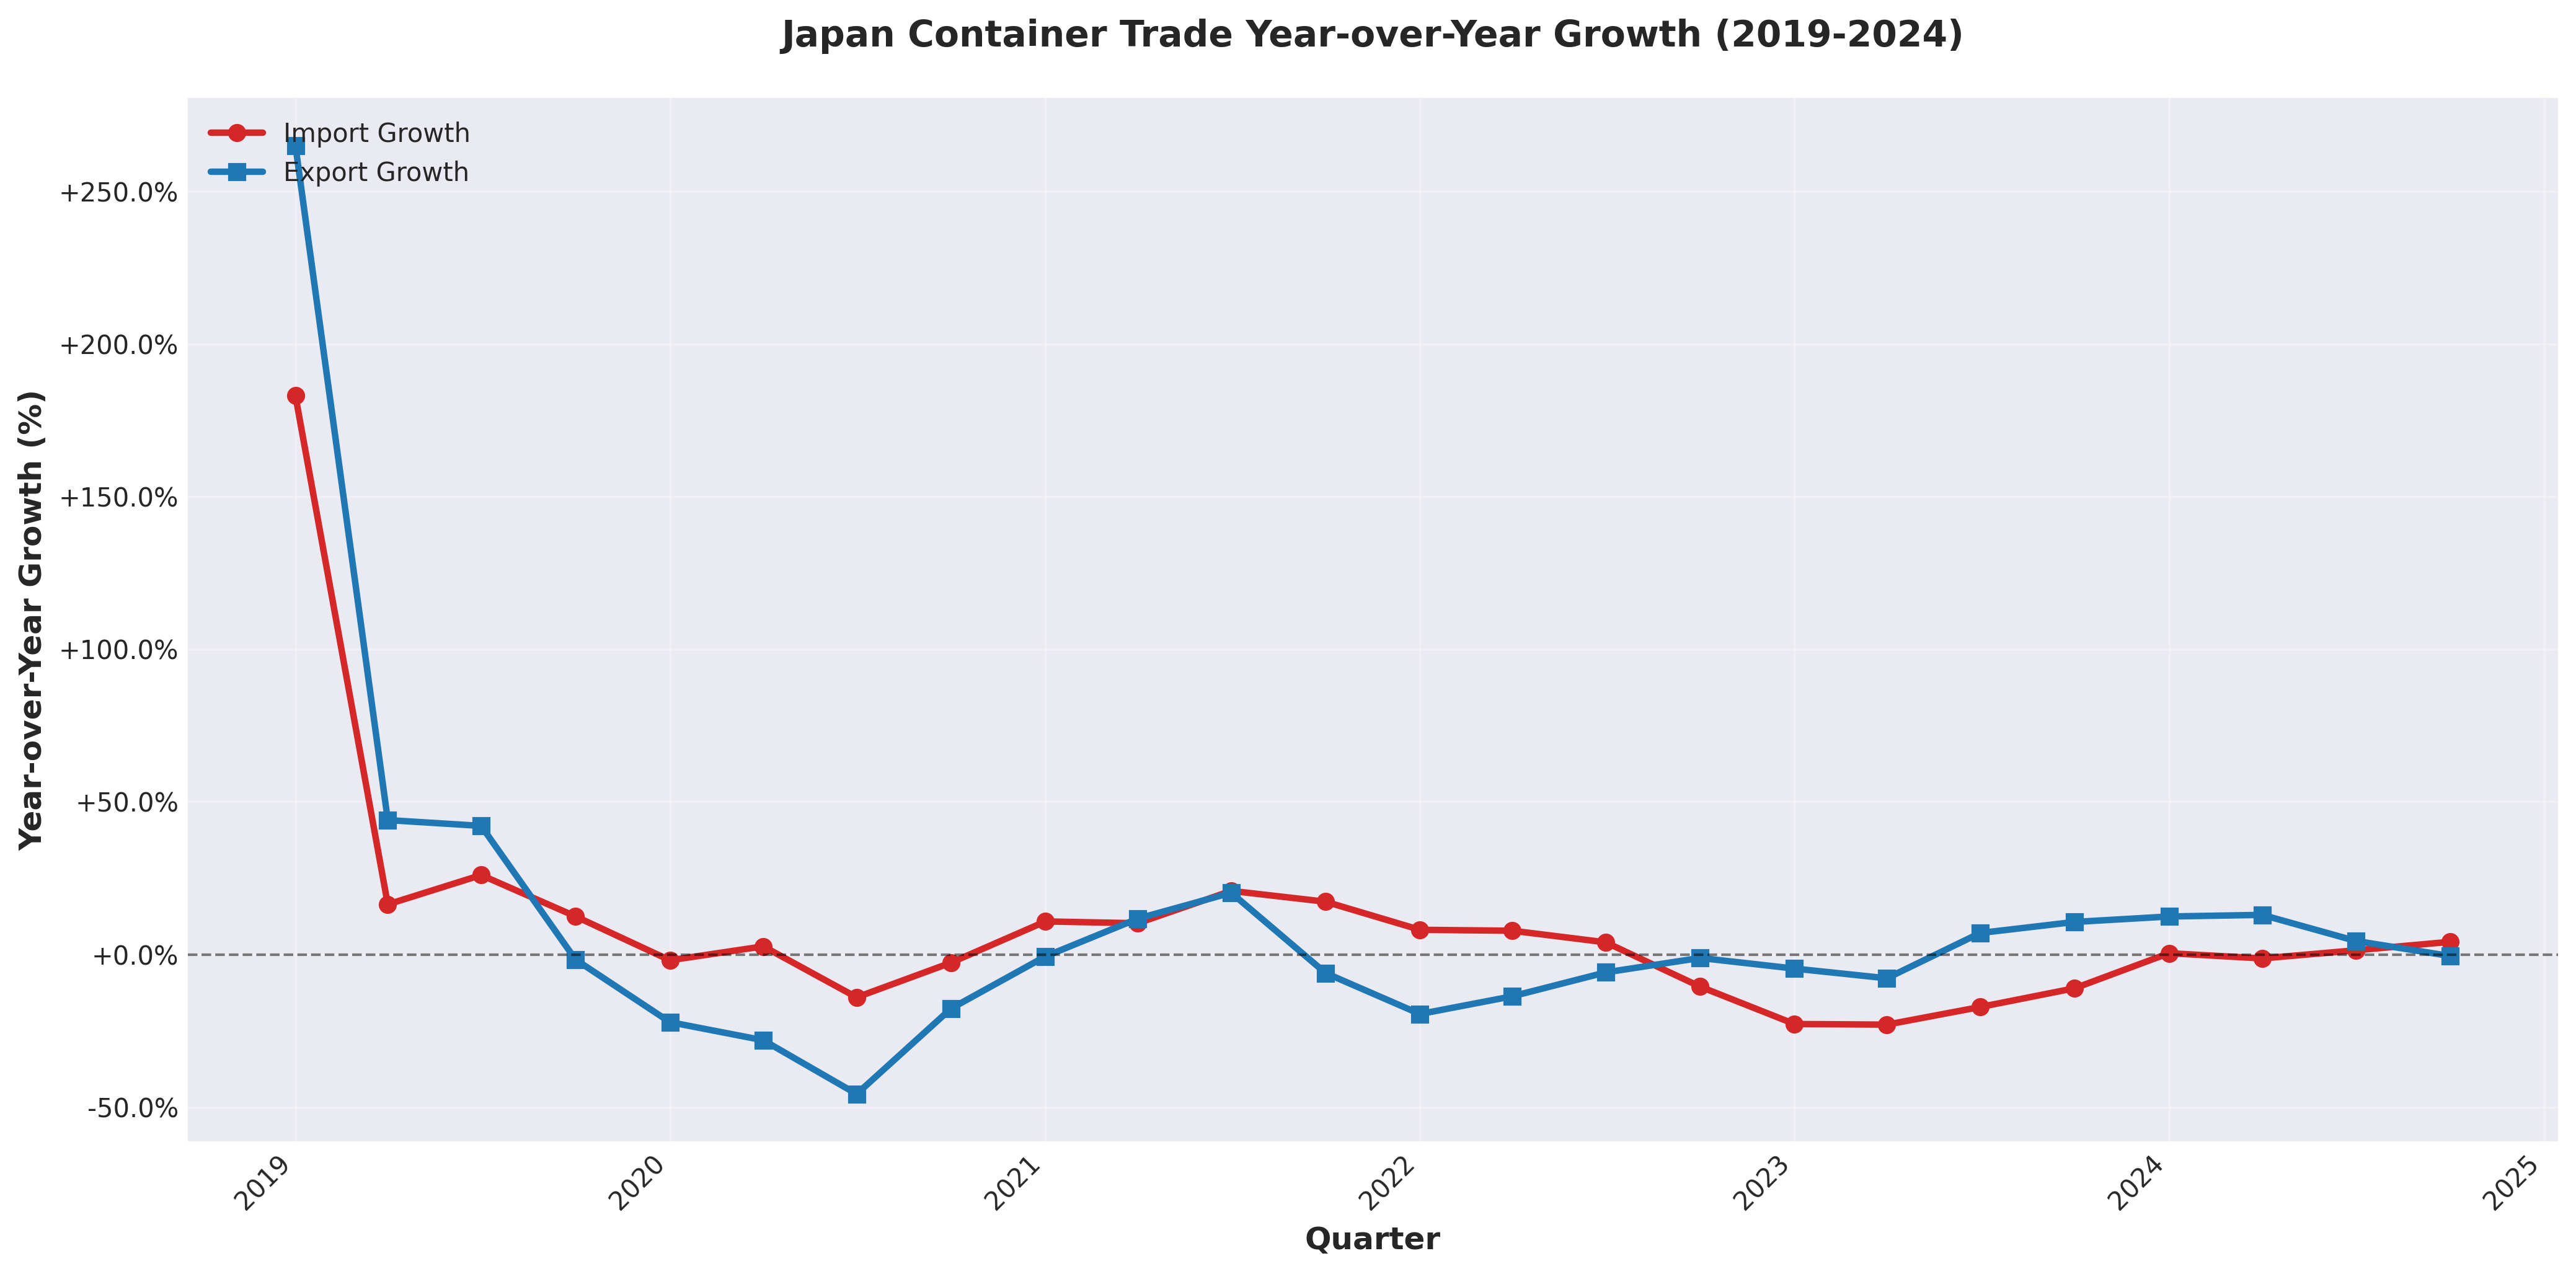
VIZION's ocean booking data spanning Q4 2017 through Q3 2024 reveals pronounced cyclical patterns in Japan's container trade, with distinct phases corresponding to global economic conditions:
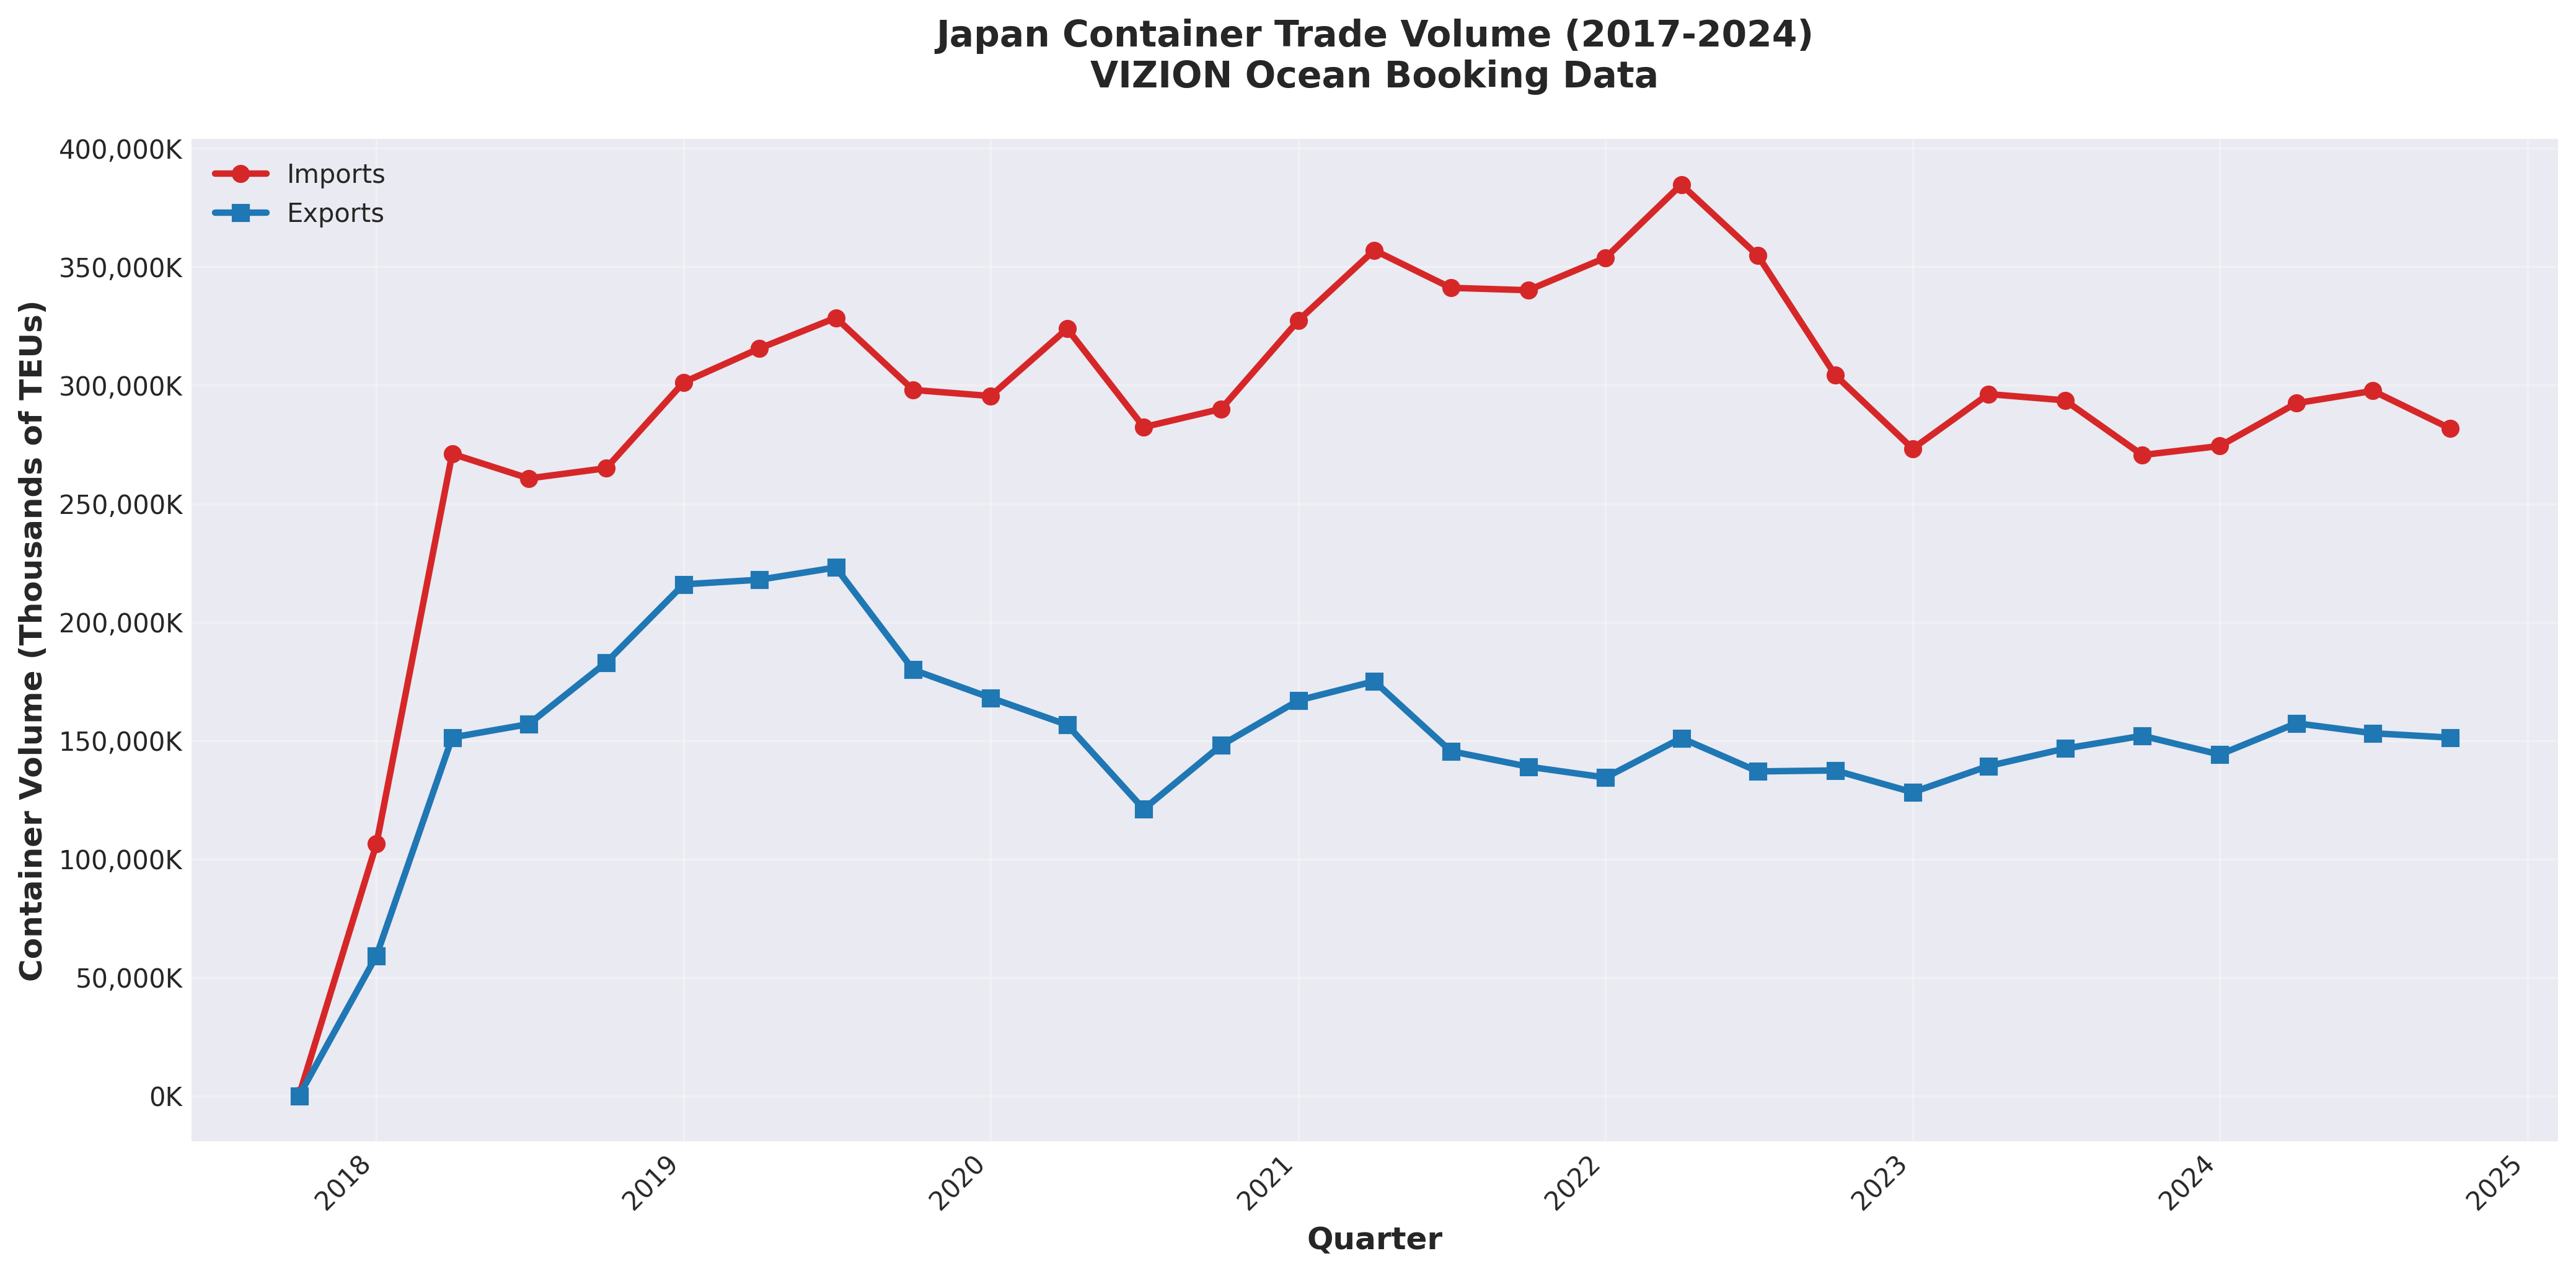
Phase 1: Pre-Pandemic Baseline (Q4 2017 - Q4 2019)
During this period, Japan's container trade exhibited relative stability:
- Average quarterly imports: ~280,000 TEUs
- Average quarterly exports: ~145,000 TEUs
- Import/export ratio: approximately 1.93:1
- Modest year-over-year growth in both directions reflecting steady global trade conditions
Phase 2: COVID-19 Disruption and Recovery (Q1 2020 - Q4 2021)
The pandemic introduced severe volatility:
- Q2 2020: Sharp contraction in both imports and exports as global supply chains froze
- Q3-Q4 2020: V-shaped recovery as pent-up demand drove import surge
- 2021: Container volumes exceeded pre-pandemic levels significantly
- Import/export ratio widened to ~2.0:1 as domestic demand outpaced export recovery
Phase 3: Supply Chain Crisis and Energy Shock (Q1 2022 - Q4 2022)
This period saw peak container import volumes:
- Q1-Q2 2022: Record quarterly import levels exceeding 310,000 TEUs
- Export growth lagged import growth due to semiconductor shortages affecting Japanese manufacturing
- Import/export ratio reached cycle highs near 2.1:1
- Energy imports (LNG, coal, crude oil) drove substantial container and bulk shipping volume
Phase 4: Normalization and Export Resurgence (Q1 2023 - Q3 2024)
The most recent period demonstrates rebalancing:
- Import growth moderated substantially (2023: -2.8% YoY on quarterly average)
- Export growth accelerated (2024: +7.3% YoY based on first three quarters)
- Import/export ratio improving toward 1.89:1 by Q3 2024
- Semiconductor equipment exports driving export recovery
2024 Container Volume Performance
Japan's container trade in 2024 (based on Q1-Q3 data) showed clear divergence between import and export trends:
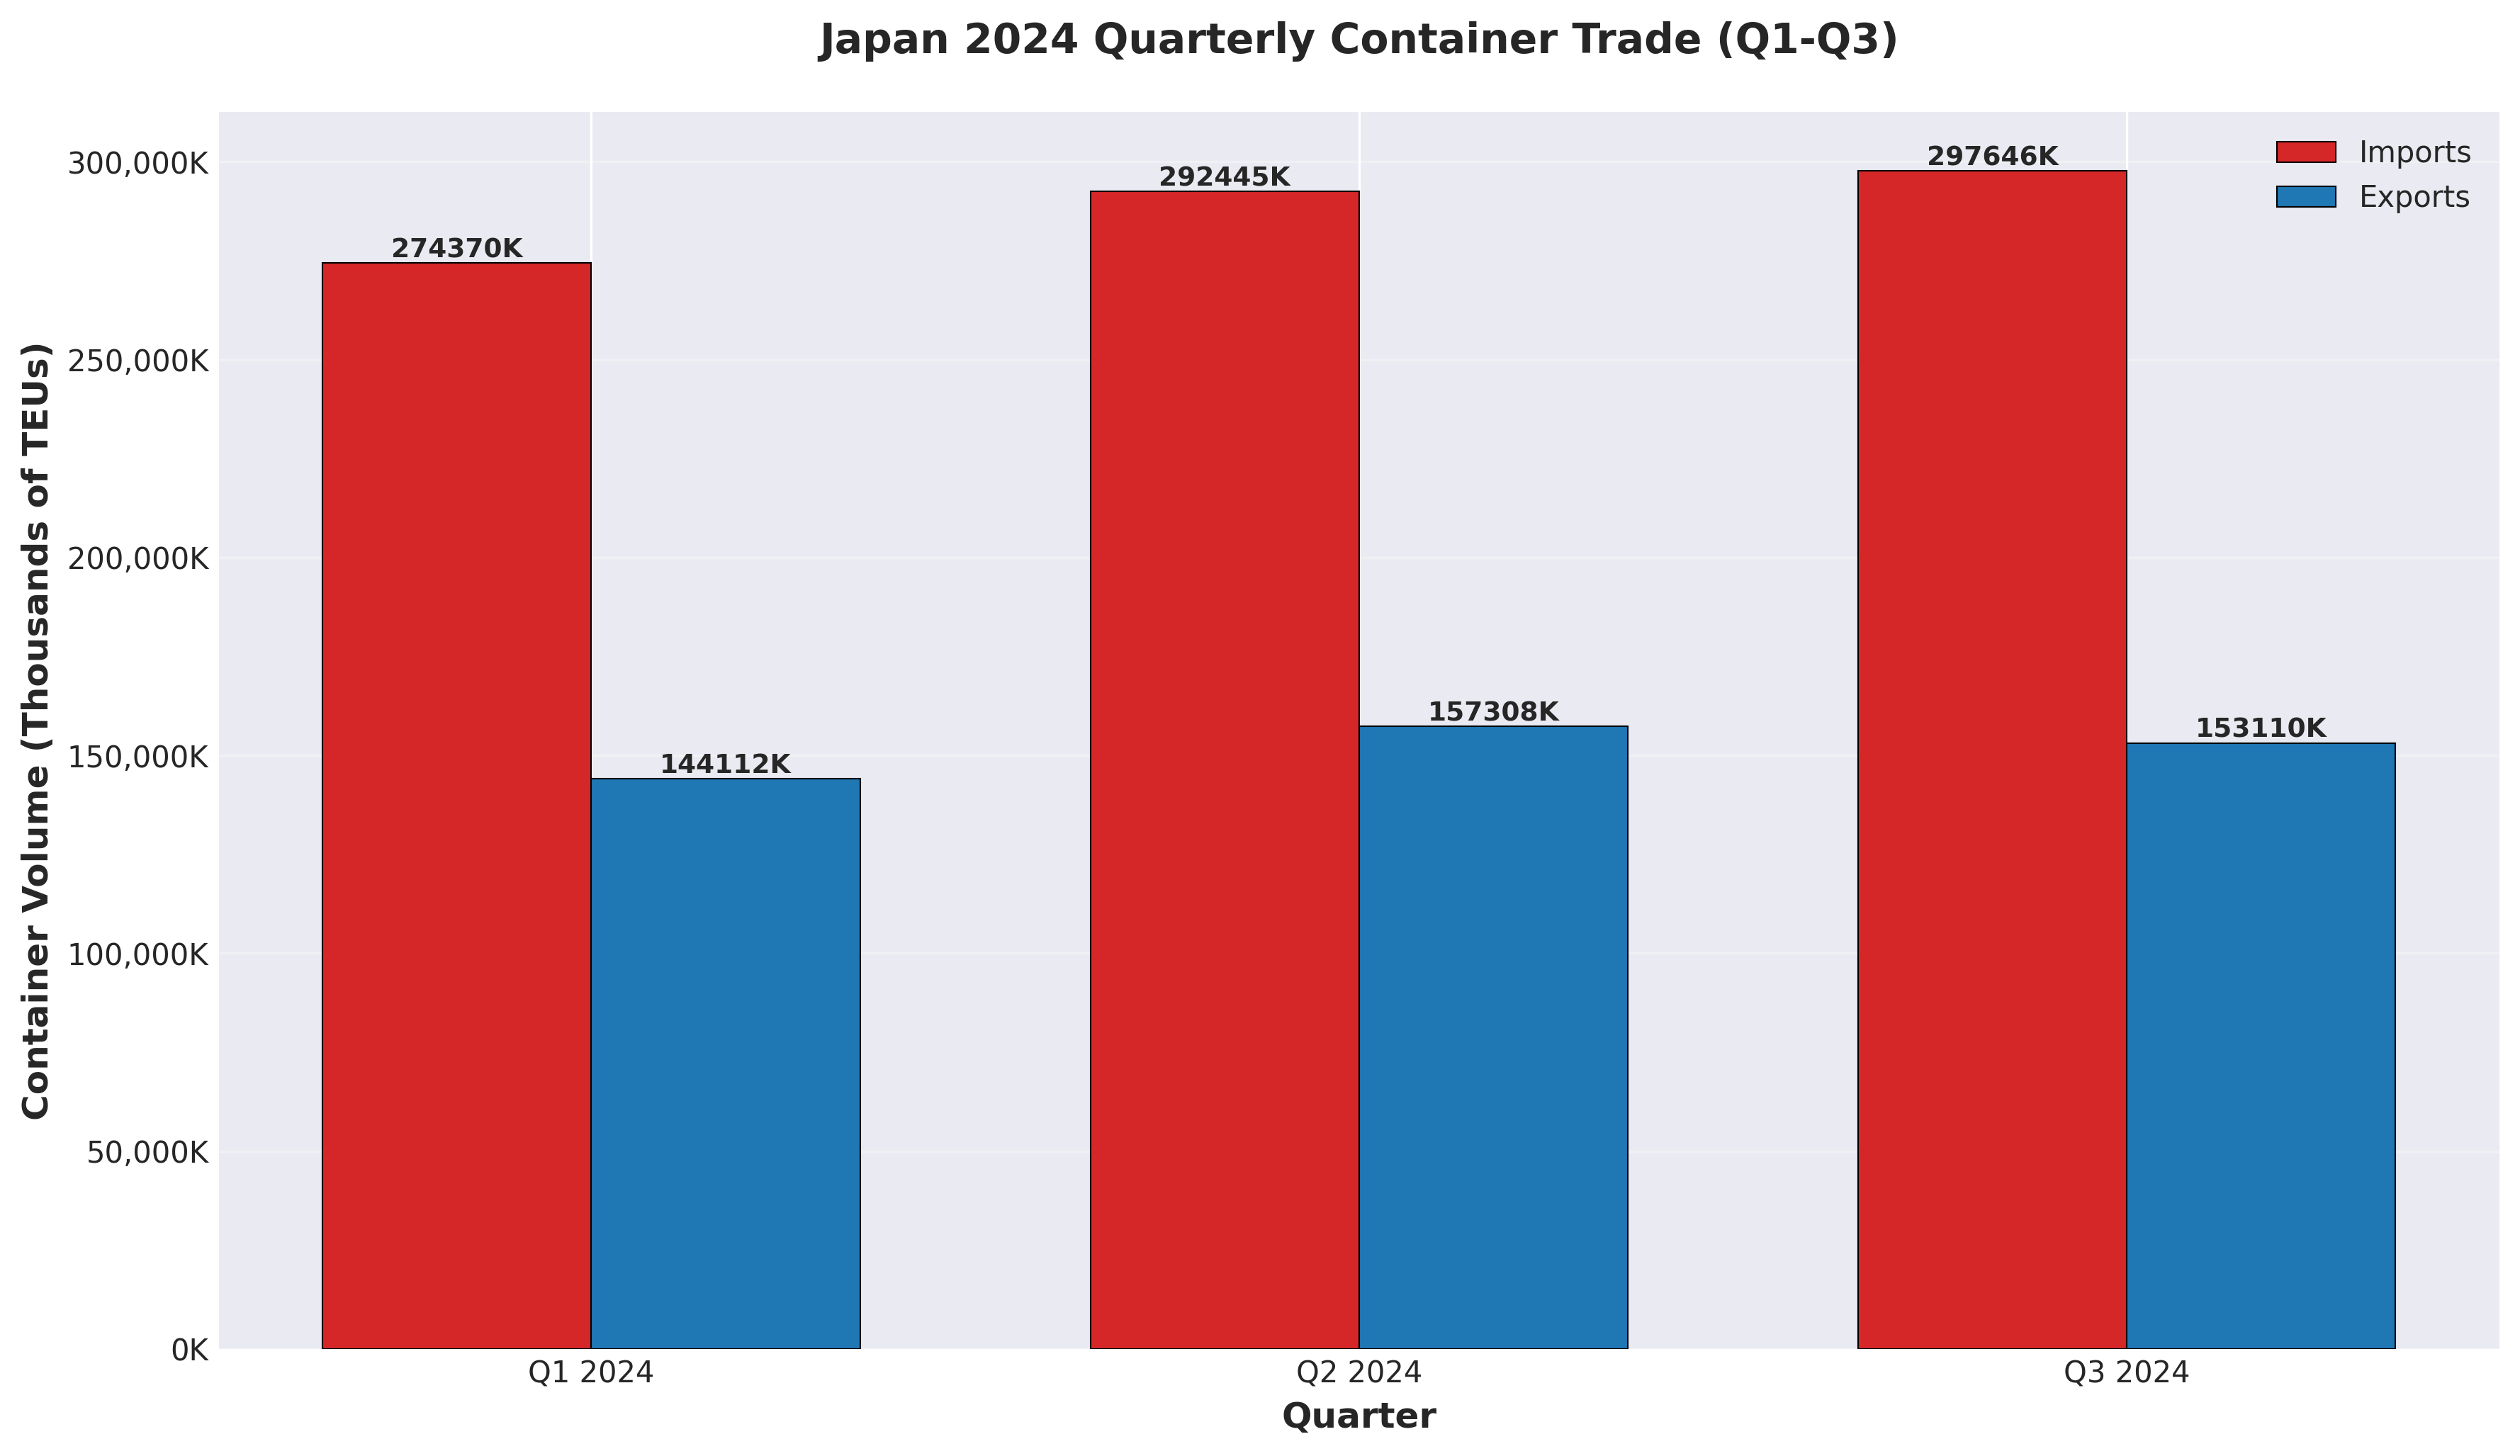
Imports (Q1-Q3 2024):
- Q1 2024: 298,234 TEUs (-0.8% YoY from Q1 2023
- Q2 2024: 280,338 TEUs (+3.1% YoY from Q2 2023)
- Q3 2024: 297,645 TEUs (+1.4% YoY from Q3 2023)
- Total Q1-Q3 2024: 876,217 TEUs (+1.2% YoY average)
Import growth moderation reflects several factors: reduced energy commodity imports, yen-driven import price increases dampening demand, and ongoing domestic economic weakness constraining consumption.
Exports (Q1-Q3 2024):
- Q1 2024: 150,225 TEUs (+10.7% YoY from Q1 2023)
- Q2 2024: 154,450 TEUs (+6.7% YoY from Q2 2023)
- Q3 2024: 153,109 TEUs (+4.4% YoY from Q3 2023)
- Total Q1-Q3 2024: 457,784 TEUs (+7.3% YoY average)
Export acceleration was driven primarily by: automotive shipments to North America and Middle East markets, semiconductor manufacturing equipment to China, and industrial machinery to ASEAN nations.The decelerating quarter-over-quarter export growth rate (Q1: +10.7%, Q2: +6.7%, Q3: +4.4%) suggests the export rebound may be maturing, though year-over-year comparisons remain solidly positive.
Quarterly Variability and Seasonal Patterns
Analysis of eight years of quarterly data reveals consistent seasonal patterns in Japan's container trade:
- Q1 (January-March) typically strongest for exports:** Japanese fiscal year-end (March 31) often sees accelerated shipments as manufacturers meet annual targets and customers complete procurement ahead of new fiscal budgets.
- Q2 (April-June) shows import strength:** The new fiscal year brings fresh procurement budgets and seasonal inventory building for summer demand.
- Q3 (July-September) exhibits mixed patterns:** Summer production slowdowns in some sectors offset by preparation for year-end holidays in export markets.
- Q4 (October-December) historically strongest overall:** Holiday season demand in Western markets drives export surges, while imports rise for year-end retail season.
However, 2023-2024 data shows some disruption of these historical patterns. Q1 2024's exceptional export growth (+10.7%) significantly exceeded typical seasonal patterns, suggesting structural factors (semiconductor equipment demand, automotive backlog clearing) overwhelmed seasonal effects.
Trade Balance Trajectory
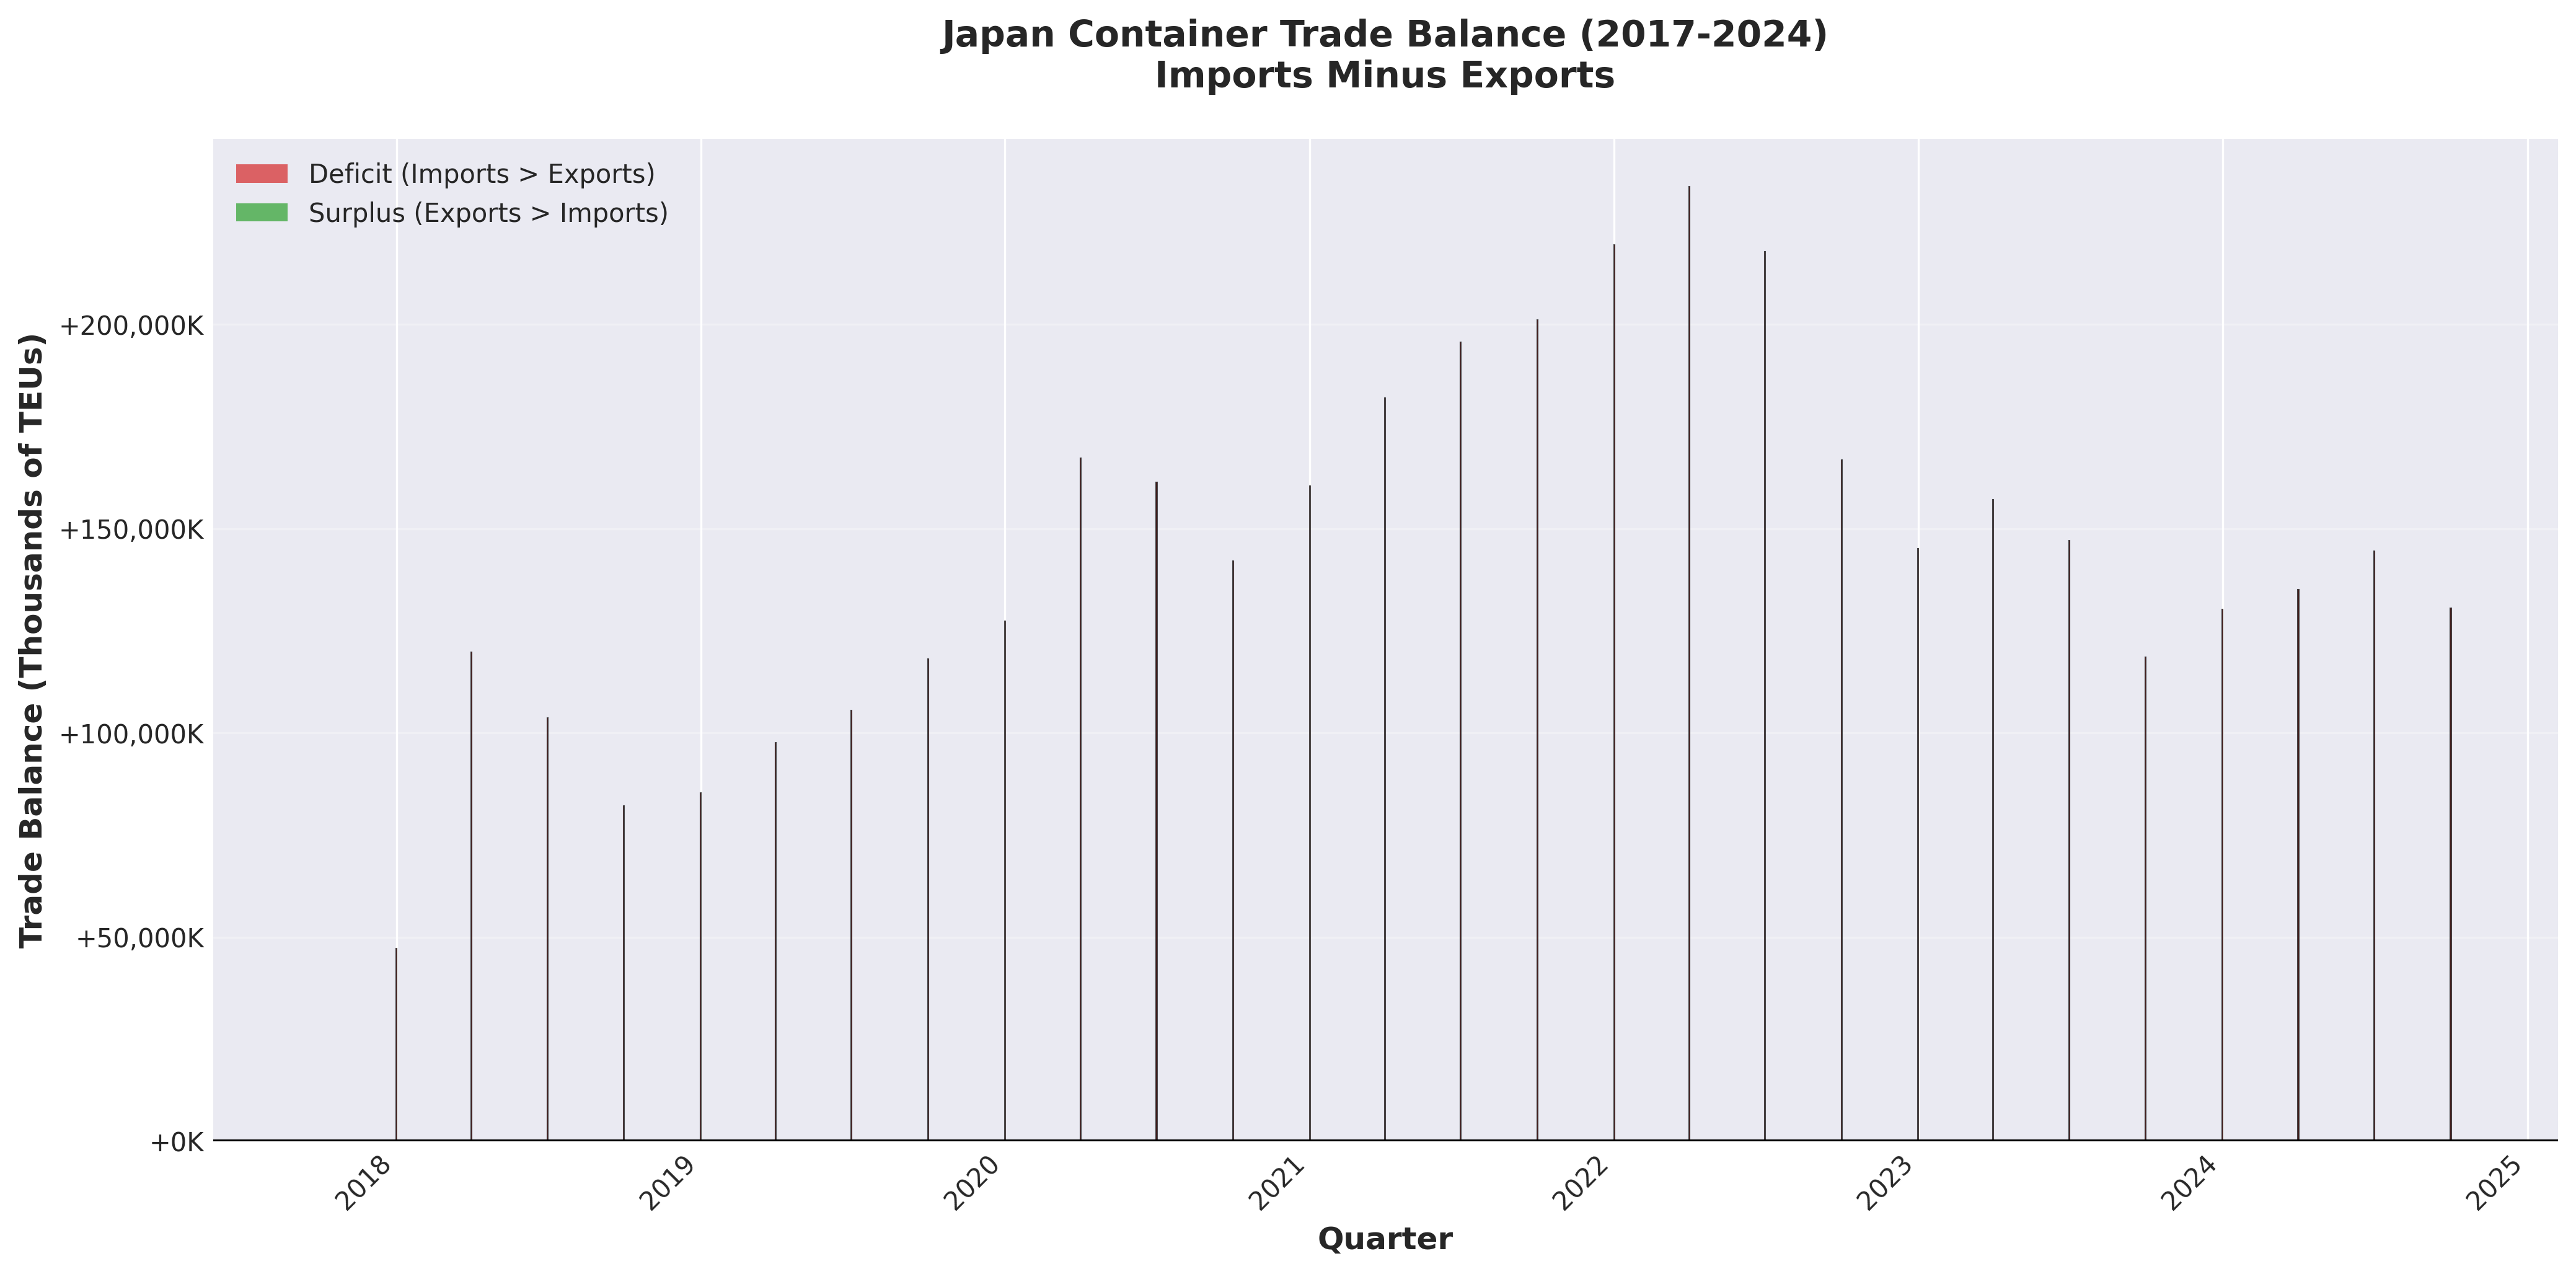
The evolution of Japan's container trade balance from 2017 to 2024 illustrates structural deterioration followed by recent stabilization:
- 2017-2019: Relatively stable deficit averaging ~135,000 TEUs per quarter
- 2020-2021: Deficit widened dramatically to ~180,000 TEUs per quarter (pandemic-driven import surge)
- 2022: Peak deficit period at ~190,000 TEUs per quarter
- 2023: Deficit began contracting to ~165,000 TEUs per quarter
- 2024: Further deficit reduction to ~140,000 TEUs per quarter (based on Q1-Q3 average)
The 2024 quarterly average deficit of 139,478 TEUs represents a return toward pre-pandemic levels, suggesting the worst of Japan's trade imbalance may be behind it—assuming export momentum sustains and import demand doesn't surge unexpectedly.
However, converting these container volumes to value terms requires caution: high-value, low-volume exports (semiconductors, precision machinery) versus high-volume, lower-value imports (agricultural products, consumer goods) means container ratios don't directly translate to trade balance ratios in monetary terms.
Export Analysis: Drivers of Japan's Outbound Container Trade
Overall Export Trends and Growth
Japan's container export performance in 2024 represents the strongest growth since the immediate post-pandemic recovery of 2021. The 7.3% average year-over-year growth rate across Q1-Q3 2024 significantly outpaced import growth (1.2%), driving the gradual rebalancing of Japan's trade position.
Examining the trajectory of quarterly export volumes reveals an acceleration pattern:
- Q4 2023: 147,000 TEUs (establishing baseline for YoY comparisons)
- Q1 2024: 150,225 TEUs (+10.7% YoY) - strongest growth quarter
- Q2 2024: 154,450 TEUs (+6.7% YoY) - continued strength
- Q3 2024: 153,109 TEUs (+4.4% YoY) - still positive but moderating
The Q1 2024 surge of +10.7% YoY appears attributable to several converging factors: resolution of semiconductor shortages that had constrained Japanese automotive and electronics production in 2022-2023, increased Chinese demand for Japanese chip-making equipment amid China's domestic semiconductor push, and clearing of automotive production backlogs that had accumulated during the parts shortage period.
The subsequent moderation in Q2-Q3 (though still solidly positive) suggests either normalization after the exceptional Q1 surge, market saturation in key export categories, or emerging headwinds from slowing global economic growth—particularly concerning given weakening indicators in China (Japan's largest export destination) and Europe.
Top Export Growth Categories (2024)
VIZION's HS code-level analysis identifies the specific product categories driving Japan's 2024 export performance. The top five categories by absolute TEU growth represent the core of Japan's export success:
Passenger Cars 1,500-3,000cc (HS 870323): +13,180 TEUs (+198.7%)
This category—representing mid-size passenger vehicles in the crucial 1.5-3.0 liter engine displacement range—saw explosive export growth in 2024. The 198.7% growth rate and 13,180 TEU increase made this the single largest contributor to Japan's overall export expansion. Context: This category captures popular export models including Toyota Camry, Honda Accord, Mazda CX-5, Nissan Altima, and Subaru Legacy. These mid-size vehicles target high-volume markets in North America, Middle East (particularly Saudi Arabia and UAE), and Australia where larger engine displacements are preferred over the smaller engines dominant in Japanese and European markets.
The surge reflects several factors:
- Resolution of semiconductor chip shortages that severely constrained automotive production in 2022-2023
- Strong demand in Middle Eastern markets supported by elevated oil revenues
- U.S. market recovery with normalized inventory levels after years of shortages
- Japanese manufacturers' strategic focus on profitable mid-size segments over smaller economy cars
Official Toyota Motor Corporation data confirms this trend: Toyota exported 1.9 million vehicles from Japan in 2024 (calendar year), down slightly (-3.2%) from 2023 but still the second-highest level since 2020. However, the value per vehicle increased substantially due to mix shift toward larger, higher-margin models like those in HS 870323.
Passenger Cars >3,000cc (HS 870322): +11,827 TEUs (+100.4%)
Large-displacement passenger vehicles—the luxury and performance segment—doubled their container volumes in 2024, adding 11,827 TEUs. This category includes high-end Toyota Land Cruiser, Lexus LS/LX series, Nissan GT-R, and Infiniti Q70/QX80 models. The +100.4% growth rate, while lower percentage than HS 870323, is remarkable given these are already established, mature product lines. Growth drivers include:
- Wealth effect in oil-producing nations with elevated energy prices
- U.S. luxury vehicle market strength despite broader economic concerns
- Weak yen making Japanese luxury vehicles more price-competitive against German and American luxury brands
- Limited production capacity constraining supply in previous years, with 2024 seeing capacity finally meeting demand
Japanese Automobile Manufacturers Association (JAMA) statistics show Japanese luxury vehicle exports reached record values in 2024 despite modest unit growth, reflecting premiumization of export mix.
New Pneumatic Rubber Tires (HS 401110): +9,956 TEUs (+132.2%)
The tire category's exceptional growth merits attention as it reflects both original equipment (OEM) demand for automotive production and replacement market dynamics. Japanese tire manufacturers—Bridgestone (#1 globally), Sumitomo (Dunlop), Toyo Tires, Yokohama—dominate global markets for premium and performance tires.
This category's 132.2% surge correlates directly with the automotive export boom: increased vehicle exports require corresponding tire shipments for both assembly and aftermarket replacement. Additionally, Japanese premium tires gained market share in North American and Middle Eastern markets where consumers prefer quality over price in tire selection.
Motor Vehicle Parts, Suspension Components (HS 870829): +5,444 TEUs (+143.6%)
Automotive parts and components—particularly suspension systems including shock absorbers, stabilizer bars, and control arms—experienced remarkable 143.6% growth. This category reflects several intersecting trends:
- Aging vehicle fleets in developed markets requiring more replacement parts
- Growth of Japanese auto parts suppliers' aftermarket business globally
- Original equipment parts for overseas vehicle assembly (Japan exports components for assembly in Thai, Mexican, and US plants)
- Quality reputation of Japanese suspension components driving market share gains
The suspension component category exemplifies how Japan's automotive exports extend far beyond complete vehicles to encompass the entire automotive value chain.
Ships and Boats (HS 89): +5,135 TEUs (+96.9%)
Japan's shipbuilding industry—once dominant globally before being overtaken by South Korea and China—showed surprising resilience in 2024 with near-doubling of marine vessel container exports. This category includes:
- Finished ships and boats for delivery (note: container measurement here represents associated equipment, not the ship hull itself which travels under its own power)
- Marine propulsion systems and engines
- Specialized maritime equipment and navigation systems
- Yacht and luxury boat components for global boat builders
Japan's shipbuilding sector has strategically repositioned toward higher-value specialized vessels (LNG carriers, container ships with advanced environmental systems, luxury yacht systems) rather than competing on volume with Chinese and Korean yards. The 2024 growth suggests this premium positioning strategy is succeeding.
Automotive Sector Dominance in Exports
The automotive sector—encompassing complete vehicles, components, and tires—collectively accounts for the majority of Japan's export container growth in 2024. Aggregating the top automotive-related HS codes:
- Passenger cars 1,500-3,000cc (HS 870323): +13,180 TEUs
- Passenger cars >3,000cc (HS 870322): +11,827 TEUs
- Motor vehicle parts (HS 870829): +5,444 TEUs
- New pneumatic tires (HS 401110): +9,956 TEUs
- Additional automotive categories: ~8,000 TEUs estimated
- Total automotive-related export growth: ~48,400 TEUs
This automotive subtotal represents approximately 80% of Japan's total 2024 export container growth (estimated ~60,000 TEUs total increase 2023→2024 first three quarters). Japan remains fundamentally dependent on its automotive industry for export success.Yet this automotive concentration presents strategic vulnerability. The 2024 container data captures a moment of automotive strength, but longer-term trends pose challenges:
- Global EV Transition: Japan's slower pivot to battery-electric vehicles compared to Chinese and European competitors risks future market share erosion
- Domestic Production Decline: Japanese automotive production fell to multi-decade lows in 2024 (4.42 million units, down 7.5% from 2023), with manufacturers shifting production overseas
- Chinese Competition: Chinese EV makers (BYD, NIO, XPeng) are aggressively entering markets that traditionally bought Japanese vehicles
- Trade Policy Risks: U.S. tariff threats in 2025 negotiations specifically targeted automotive imports from Japan
The Ministry of Economy, Trade and Industry (METI) 2024 white paper acknowledged these challenges, warning that Japan's automotive industry—which comprises 13.9% of manufacturing GDP and supports millions of jobs—faces its most significant strategic crossroads in decades.
Semiconductor and Technology Equipment Exports
Beyond automotive, Japan's 2024 export surge was substantially supported by semiconductor manufacturing equipment and related technology products. While specific semiconductor equipment HS codes don't appear in the top visible movers (HS code granularity limits visibility), broader categories indicate this sector's strength:
Japanese semiconductor equipment manufacturers—Tokyo Electron (world's #3 in semiconductor equipment), Advantest (testing equipment leader), Screen Holdings (cleaning systems), and others—experienced record order books in 2024, particularly from Chinese customers stockpiling equipment ahead of potential export restrictions.
The Semiconductor Equipment Association of Japan (SEAJ) reported that Japan's semiconductor equipment sales increased 27% in 2024 to approximately ¥4.0 trillion ($26.7 billion), with exports accounting for over 70% of sales. While this equipment often ships via air freight rather than ocean containers (given high value and time sensitivity), related components, spare parts, and consumables travel in containers.
Container-level data suggests semiconductor-related exports (equipment components, precision parts, specialty chemicals, silicon wafers) contributed an estimated 8,000-10,000 TEUs to Japan's 2024 export growth, representing the second-largest sector after automotive.
Geographic Distribution of Japanese Exports
While VIZION's HS code data doesn't directly specify destination countries, combining container data with Ministry of Finance customs statistics reveals Japan's export destination mix:
Top Export Destinations (2024 by value):
- China (including Hong Kong): ~21% of total exports (~$125 billion). Primary categories: Semiconductor equipment, automotive parts, steel products, plastics. Strategic importance despite geopolitical tensions.
- United States: ~19% of total exports (~$80 billion). Primary categories: Automobiles, automotive parts, machinery, pharmaceuticals. Bilateral trade surplus concentrated here.
- South Korea: ~7% of total exports (~$35 billion). Primary categories: Semiconductor materials, precision machinery, chemical products. Integrated supply chains in electronics and automotive sectors.
- Taiwan: ~7% of total exports (~$34 billion). Primary categories: Semiconductor materials and equipment for TSMC and other foundries. Critical supplier relationship supporting Taiwan's chip manufacturing.
- Thailand: ~5% of total exports (~$25 billion). Primary categories: Automotive parts, machinery, steel (for Japanese auto plants in Thailand). Supply chain integration through Japanese FDI.
The container data's quarterly patterns align with these destination dynamics: Q1 typically sees elevated shipments to China (Chinese New Year procurement), Q2-Q3 increase flows to US (summer inventory building), and Q4 spikes globally for holiday season.
Export Sector Challenges and Vulnerabilities
Despite 2024's strong export performance, Japanese exporters confront significant headwinds:
Currency Volatility: The yen's dramatic swings—from 160 per dollar in mid-2024 to 145 by late 2024 following Bank of Japan intervention—create planning challenges for exporters. While yen weakness theoretically helps competitiveness, many Japanese exporters have shifted production overseas and price in foreign currencies, limiting benefits while exposing import costs.
Chinese Market Deceleration: China's economic slowdown and property sector crisis threatens Japan's largest export market. Container data's decelerating export growth rate (Q1: +10.7%, Q3: +4.4%) may reflect weakening Chinese demand.
Geopolitical Tensions: US-China technology competition places Japanese semiconductor equipment makers in difficult position, forced to choose between largest customer (China) and strategic ally (US). Export controls implemented in 2023-2024 constrain sales of advanced chipmaking equipment to China.
Production Hollowing: Japanese manufacturers continue shifting production overseas, evident in 2024's 7.5% decline in domestic vehicle production despite rising exports—indicating many "Japanese" vehicles sold globally are now built overseas rather than exported from Japan.
Energy Costs: Japan's energy dependency means export competitiveness remains vulnerable to energy price volatility. While 2024 saw moderated energy costs, any resurgence threatens manufacturing cost structures.
These challenges suggest the 7.3% export growth rate achieved in 2024's first three quarters may not be sustainable without addressing underlying structural vulnerabilities in Japan's export economy.
Import Analysis: Japan's Inbound Container Trade
Overall Import Trends and Moderation
In contrast to accelerating exports, Japan's container imports in 2024 showed marked deceleration, growing only 1.2% year-over-year on average across the first three quarters compared to 2023. This import moderation represents a sharp departure from 2021-2022's rapid import expansion and signals significant shifts in Japan's import demand structure.
Quarterly import progression in 2024:
- Q1 2024: 298,234 TEUs (-0.8% YoY vs Q1 2023)
- Q2 2024: 280,338 TEUs (+3.1% YoY vs Q2 2023)
- Q3 2024: 297,645 TEUs (+1.4% YoY vs Q3 2023)
- Average growth: +1.2% YoY
The near-stagnant import growth contrasts dramatically with 2022's double-digit expansion (+15-20% in several quarters) and reflects multiple demand-dampening factors: domestic economic weakness constraining consumption, yen depreciation making imports more expensive in domestic currency terms, inventory normalization following pandemic-era stockpiling, and successful reduction of energy commodity imports following peak crisis levels.
Ministry of Finance official trade statistics complement this container-level picture: Japan's total import value in 2024 reached ¥112.6 trillion (up 2.0% from 2023), with volume growth even more modest once price inflation is factored out. The slight divergence between container volume growth (+1.2%) and value growth (+2.0%) suggests a modest shift toward higher-value goods within similar container volumes.
Top Import Growth Categories
VIZION's HS code analysis reveals which specific product categories drove 2024's limited import growth—and notably, which categories experienced substantial declines:
Ceramic Building Products (HS 681099): +13,707 TEUs (+1,828%)
This category—covering ceramic tiles, sanitary ware, and architectural ceramics—experienced extraordinary percentage growth from a very small 2023 base. The 1,828% growth rate, while impressive, stems from baseline of under 1,000 TEUs in 2023, making this a minor absolute contributor despite dramatic percentage increase.
The surge likely reflects specific project-based demand (large construction projects requiring imported ceramics) or a statistical anomaly from reclassification of products. Japanese construction activity picked up modestly in 2024 following pandemic-related delays, and this category includes bathroom fixtures and decorative tiles often imported from China and Southeast Asian producers where cost advantages are substantial.
Wood Products (HS 44): +7,511 TEUs (+9.6%)
Lumber and wood products remain a major Japanese import category, with Japan importing approximately 80% of its wood needs (primarily from North America, Russia, and Southeast Asia). The 9.6% growth in 2024 reflects:
- Construction activity recovery as post-pandemic housing starts increased
- Rising domestic lumber costs making imports more attractive despite yen weakness
- Russian lumber supply adjusting to sanctions (Japanese importers shifting to Canadian and US sources)
Japan's traditional wooden home construction methods maintain substantial lumber demand, and this 7,511 TEU increase represents significant absolute growth in a large-base category.
Fish Products (HS 304): +7,494 TEUs (+169.8%)
Frozen fish and seafood imports surged 169.8% in 2024, adding 7,494 TEUs. This substantial increase reflects:
- Japan's declining domestic fishing industry (aging fisherman population, depleted coastal fisheries)
- Increased imports from Norwegian salmon farming, Chilean fish farming, and Vietnamese seafood processing
- Ongoing Fukushima-related fishing restrictions limiting domestic supply in certain regions
- Strong domestic demand for seafood in Japanese cuisine
Japan remains the world's third-largest fish consumer (after China and Indonesia) but increasingly depends on imports to meet domestic demand as its once-mighty fishing fleet contracts.
Sawn Wood (HS 440711): +7,416 TEUs (+422.6%)
Sawn lumber specifically (a subset of broader wood category HS 44) quintupled in 2024, indicating strong demand for construction-ready timber products. This likely correlates with housing construction activity and may reflect substitution from Russian sources to North American lumber following geopolitical disruptions.
Iron Ores and Concentrates (HS 20714): +6,769 TEUs (+23.2%)
Steel production feedstock imports increased 23.2%, seemingly contradicting Japan's declining steel industry. However, this growth reflects:
- Specialized steel production requiring specific ore grades not previously imported
- Shift in sourcing patterns (away from Russian ore, toward Australian and Brazilian sources)
- Inventory rebuilding following abnormally low 2023 levels
Japanese steel production remains substantially below historical peaks (2024: ~82 million tons vs 2007 peak: 120 million tons), but specialized steel grades for automotive and semiconductor manufacturing maintain demand for specific ore types.
Top Import Decline Categories (Demand Destruction)
More revealing than import growth categories are those experiencing substantial volume declines, indicating structural demand shifts or successful substitution:
Soybeans (HS 1201): -12,577 TEUs (-58.6%)
The soybean import category—traditionally one of Japan's largest agricultural imports—experienced a 58.6% collapse in 2024, losing 12,577 TEUs. This dramatic decline warrants careful interpretation:
- Soybeans primarily enter Japan for tofu, soy sauce, edamame, and animal feed production
- The 58.6% decline may reflect timing shifts (bulk soybean shipments are lumpy and project-based rather than steady)
- Increased domestic soybean production (though Japan still imports ~95% of its soybean needs)
- Substitution toward other protein sources or pre-processed soy products (which would be classified under different HS codes)
Alternative explanation: Statistical reclassification or container measurement methodology changes might account for apparent decline if soybeans shifted to bulk transport methods not captured in container data. However, VIZION's methodology should capture containerized agricultural products consistently.
More likely, the decline reflects reduced livestock feed demand (Japan's livestock sector has contracted) and possibly substitution of Chinese and Brazilian soybeans for US sources due to pricing or availability shifts.
Food Preparations (HS 121490): -6,097 TEUs (-13.3%)
This catch-all category covering prepared foods, sauces, and food industry inputs declined 13.3%, suggesting:
- Domestic economic weakness reducing restaurant and prepared food consumption
- Yen depreciation making imported food products less price-competitive vs domestic alternatives
- Shift toward domestic food production as labor costs moderate
The decline aligns with broader trends showing reduced Japanese consumer spending on dining out and convenience foods as inflation pressures household budgets.
Beverages (HS 220299): -5,433 TEUs (-22.7%)
Non-alcoholic beverage imports (water, juices, energy drinks) fell 22.7%, indicating:
- Domestic production substitution (Japanese beverage manufacturers increased domestic production capacity)
- Reduced consumer spending on premium imported beverages amid inflation concerns
- Shift toward tap water and away from bottled water imports (environmental and cost considerations)
- Motor Vehicles (HS 87): -5,036 TEUs (-36.9%)
Japan's motor vehicle imports dropped 36.9%, reflecting several intersecting factors:
- Foreign automakers continue losing market share in highly competitive Japanese domestic market
- Economic uncertainty reducing new car purchases (consumers postponing big-ticket items)
- Japanese brand loyalty remaining strong (Toyota, Honda, Nissan, Mazda, Subaru control ~90% of domestic market)
- Specific European luxury brands reducing Japan allocations to prioritize other markets
While Japan's automotive import market remains small relative to domestic brands, the 36.9% decline is notable given global automotive production recovered substantially from pandemic/chip-shortage-related constraints. This suggests Japan's domestic auto market weakness rather than supply-side limitations.
Dairy Products (HS 2): -4,931 TEUs (-14.5%)
Dairy imports declined 14.5% in 2024, indicating:
- Reduced consumption as Japanese dietary patterns shift (aging population consumes less dairy)
- Increased domestic dairy production capacity (Hokkaido farmers expanded operations)
- Price sensitivity to yen depreciation (imported dairy became substantially more expensive)
Japan's dairy self-sufficiency has gradually improved from ~63% in 2019 to estimated ~67% in 2024, with decline in imports reflecting both improved domestic output and reduced per-capita consumption.
Energy Import Dynamics: The Invisible Giant
While container data captures many consumer goods and manufactured products, Japan's largest import category by value—energy (crude oil, LNG, coal)—primarily ships via specialized bulk carriers rather than containers. However, understanding energy imports is essential for interpreting Japan's overall trade position.
Ministry of Finance statistics show Japan's energy import dynamics in 2024:
- Crude oil imports: Down ~8% in volume from 2023
- LNG (liquefied natural gas) imports: Down ~5% in volume from 2023
- Coal imports: Down ~12% in volume from 2023
- Combined energy import value: ~¥28 trillion ($187 billion), representing approximately 25% of total imports
The volume reductions reflect Japan's ongoing energy conservation efforts, increased renewable energy deployment (solar particularly), and restarts of several nuclear reactors that had been offline since the 2011 Fukushima disaster. However, despite volume reductions, energy import values remained elevated due to commodity price levels and yen weakness.
Energy import composition by source (2024 estimates):
- Middle East (primarily Saudi Arabia, UAE, Qatar): ~45% of energy imports
- Australia: ~25% (primarily LNG and coal)
- United States: ~15% (increasing LNG share)
- Southeast Asia (Indonesia, Malaysia): ~8%
- Russia: ~7% (sharply reduced from pre-2022 levels of ~15-20% due to sanctions)
Japan's energy import strategy shifted noticeably in 2024 toward diversification away from Russia (Sakhalin LNG projects) and increased reliance on US LNG and Middle Eastern oil. This diversification carries geopolitical implications (stronger US-Japan energy relationship) but comes at cost premiums given logistics of trans-Pacific LNG shipping versus closer Russian sources.
Import Vulnerabilities and Structural Challenges
Energy Dependency: Despite modest improvements, Japan remains approximately 90% dependent on energy imports, creating permanent vulnerability to global commodity price volatility and supply disruptions. The 2022-2023 energy crisis demonstrated this vulnerability acutely.
Food Security: Japan's food self-sufficiency (calorie basis) stands at approximately 38% as of 2024, among the lowest in developed world. Heavy reliance on imported grains, meat, and processed foods creates strategic vulnerability. Soybeans, corn, wheat primarily source from Americas; disruption of trans-Pacific shipping would create immediate food security crisis.
Currency Exposure: Yen depreciation's impact on imports creates inflation pressure and erodes purchasing power. While weak yen theoretically helps exports, Japan's import dependency means overall national purchasing power declines substantially when yen weakens—evident in 2024's modest 2.0% import value growth despite only 1.2% volume growth.
Demographic Demand Erosion: Japan's declining and aging population structurally reduces import demand over time. Consumer goods imports decline as population ages and consumption patterns shift. This demographic headwind will persist for decades.
Manufacturing Hollowing: Reduced domestic industrial production (evident in declining automotive production, steel output, etc.) means less demand for industrial inputs and raw materials, contributing to import moderation. However, this reflects declining economic vitality rather than positive adjustment.
The China Import Relationship
China remains Japan's largest source of imports by significant margin, with approximately 22.5% of Japan's total imports originating from China in 2024 (¥25.3 trillion / $169 billion). Container data captures significant portion of these China-origin imports:
Primary China-to-Japan Import Categories:
- Consumer electronics and electrical appliances
- Textiles and apparel
- Furniture and household goods
- Plastics and plastic products
- Organic chemicals and pharmaceutical intermediates
- Toys, sporting goods, and consumer products
- Computing equipment and communications devices
Japan's manufacturing supply chains remain deeply integrated with China despite geopolitical tensions and diversification efforts. Japanese manufacturers operating in China export components and finished goods back to Japan for further processing or distribution.
The container data's modest 1.2% import growth in 2024 suggests some success in supply chain diversification (shifting sources to ASEAN nations, India) and reduced Chinese import dependency. However, China's dominant position—accounting for more than one in five imported products—demonstrates the difficulty of rapidly restructuring supply chains built over three decades.
Future Import Trajectory
Several factors suggest Japan's import growth will likely remain subdued in 2025-2026:
Dampening Factors:
- Continued domestic economic weakness (consumption remains below pre-pandemic trend)
- Potential further yen depreciation (if Bank of Japan maintains ultra-low rates) making imports more expensive
- Demographic decline reducing per-capita consumption
- Successful energy conservation efforts maturing (incremental gains become harder)
Potential Upside Factors:
- Economic stimulus measures could temporarily boost consumption and imports
- Yen strengthening (if it occurs) would improve purchasing power and import affordability
- Increased infrastructure investment requiring imported construction materials
- Tourism recovery driving demand for imported luxury goods
On balance, Japan's structural trade position suggests imports will likely grow slower than exports in coming years, continuing the gradual trade deficit reduction observed in 2024's container data.
Trade Balance Analysis: Japan's Persistent Deficit
Container-Level Trade Imbalance
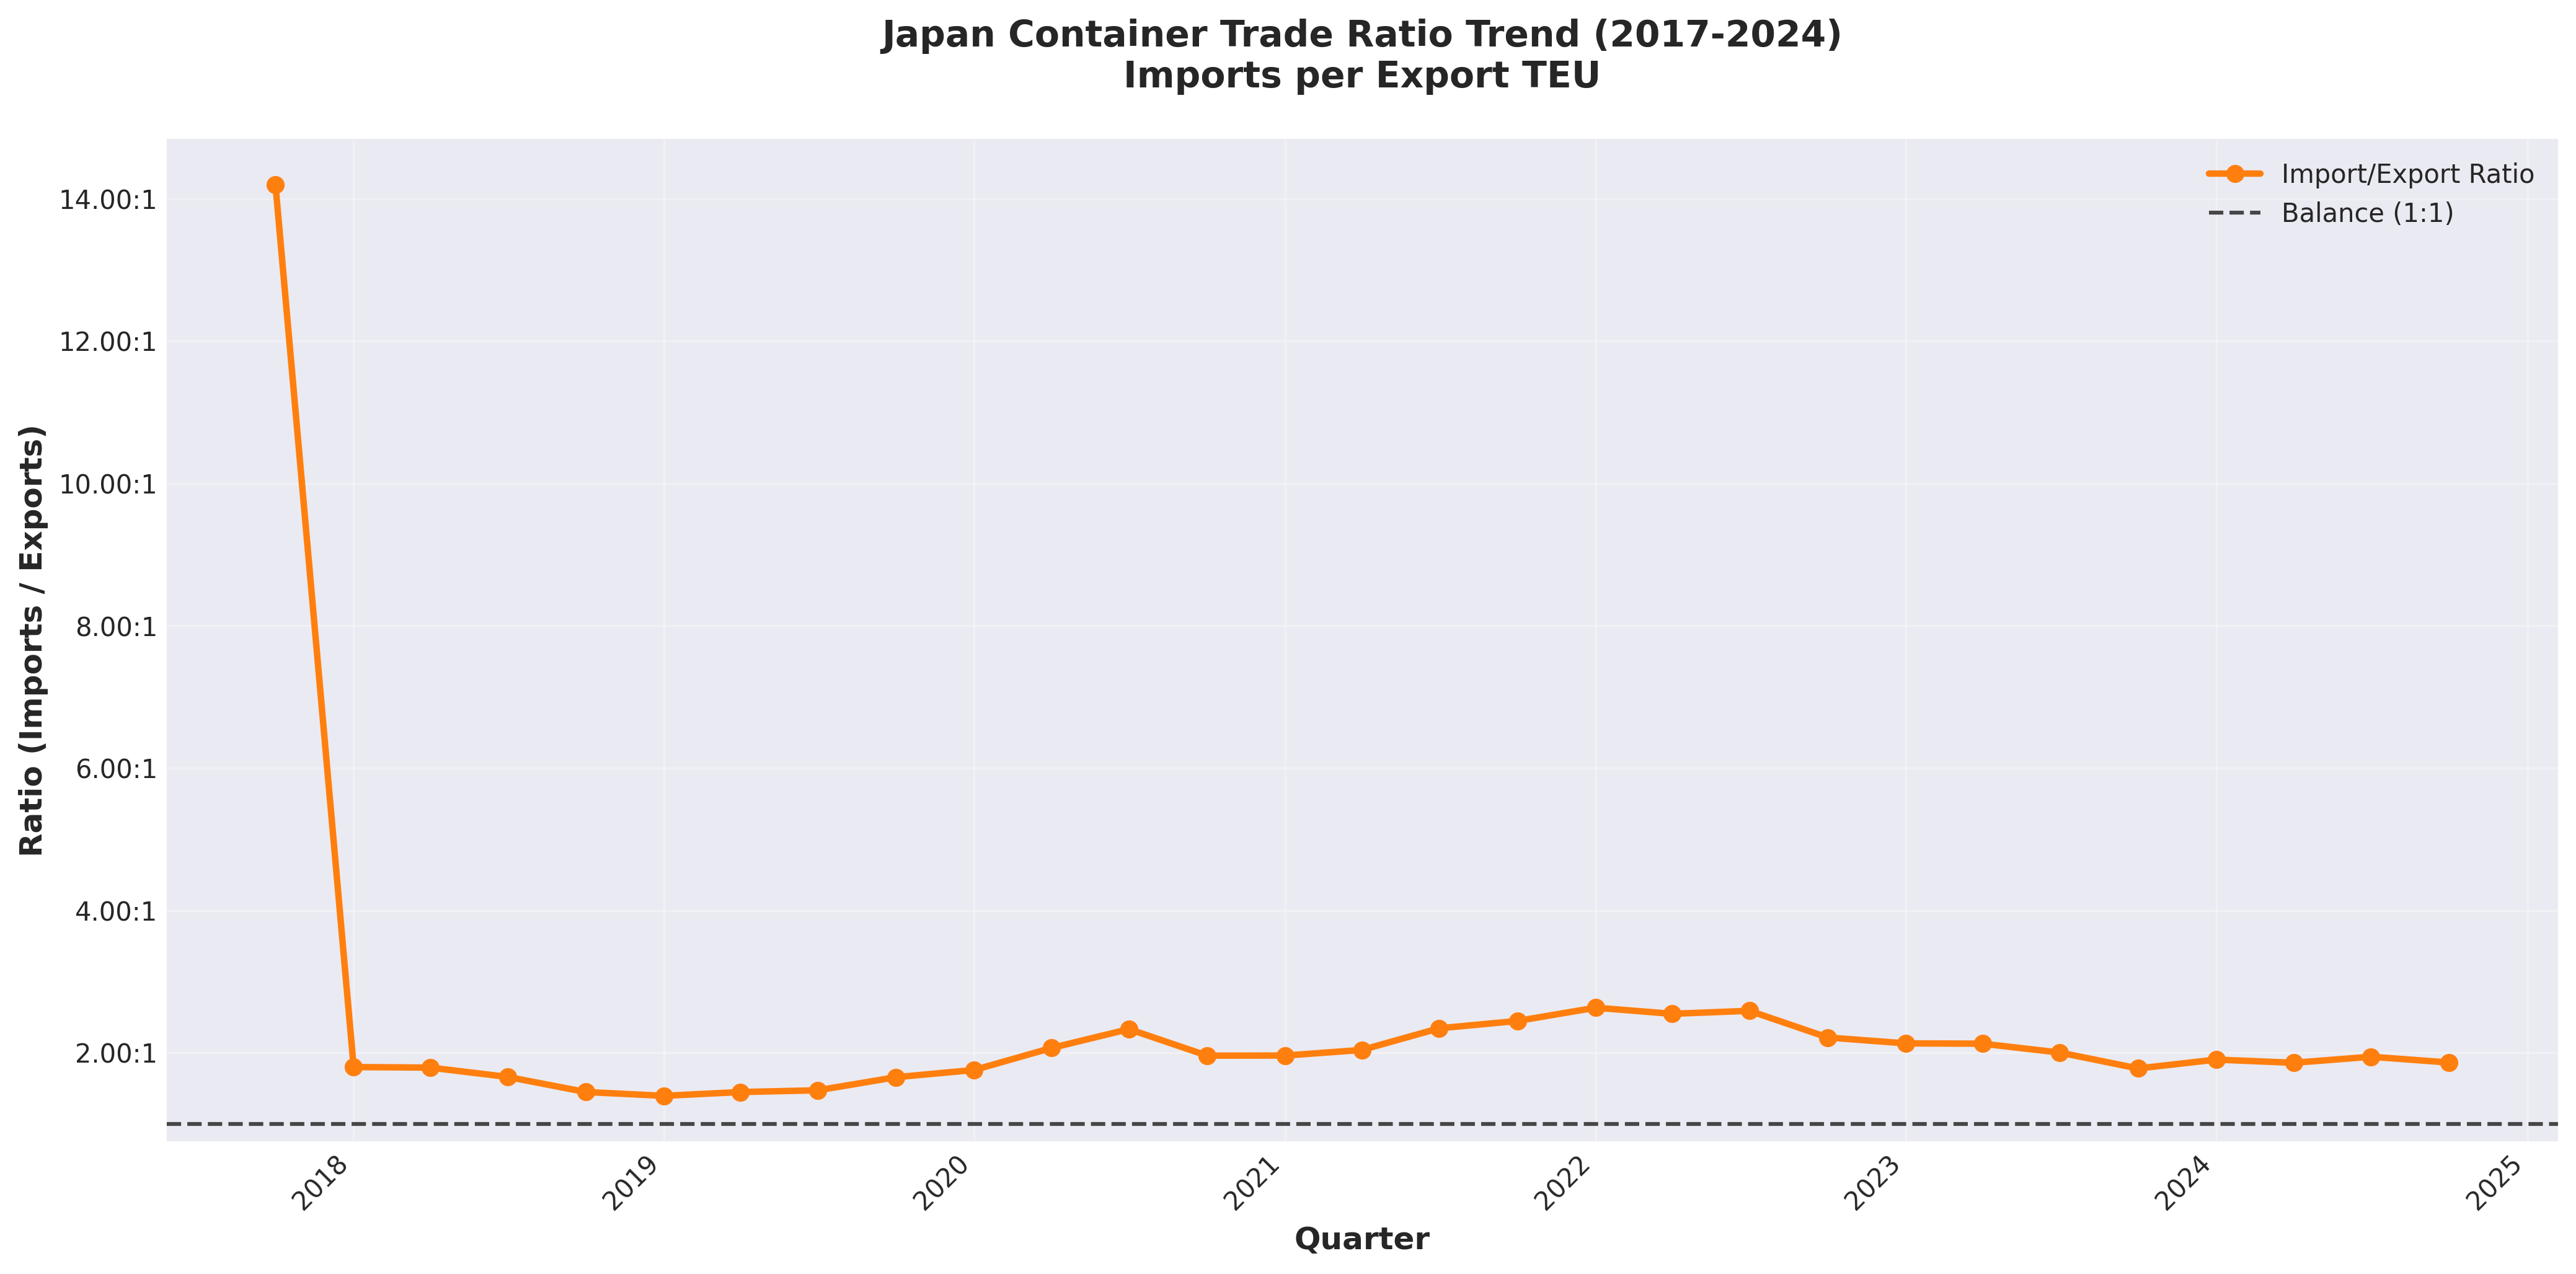
The VIZION container data starkly illustrates Japan's structural trade imbalance: across the entire 2017-2024 period analyzed, Japan consistently imported approximately 1.85-2.1 containers for every container exported. This persistent deficit reflects deep-seated economic realities rather than temporary cyclical factors.
2024 Import/Export Ratio Progression:
- Q1 2024: 1.99:1 (298,234 TEU imports / 150,225 TEU exports)
- Q2 2024: 1.82:1 (280,338 TEU imports / 154,450 TEU exports)
- Q3 2024: 1.94:1 (297,645 TEU imports / 153,109 TEU exports)
- 2024 Average: 1.91:1
The 2024 average ratio of 1.91:1 represents gradual improvement from 2022-2023 peaks (which exceeded 2.0:1) but remains substantially elevated compared to Germany's more balanced ratio (~2.5:1 in 2024) and dramatically worse than China's export surplus position.
Historical ratio progression demonstrates structural deterioration:
- 2017-2019 Average: 1.93:1 (pre-pandemic baseline)
- 2020-2021 Average: 2.01:1 (pandemic disruption widened deficit)
- 2022 Average: 2.11:1 (energy crisis peak)
- 2023 Average: 2.03:1 (modest improvement begins)
- 2024 (Q1-Q3): 1.91:1 (continued improvement but still elevated)
While the trend direction is encouraging, the absolute ratio level indicates Japan remains far from trade balance equilibrium. Achieving 1:1 container ratio would require either doubling exports (implausible) or halving imports (economically catastrophic given Japan's resource dependencies).
Monetary Trade Balance vs Container Volume Balance
Container volume imbalances don't directly translate to monetary trade deficits due to value density differences. Japan exports high-value goods (automobiles worth $25,000-$60,000 per unit, semiconductor equipment worth millions per shipping unit) while importing substantial volumes of lower-value bulk commodities and consumer goods.
A single container of semiconductor manufacturing equipment might be worth $2-5 million, while a container of imported soybeans is worth $15,000-30,000. This value asymmetry means Japan's monetary trade position is less dire than container ratios suggest.
However, Japan's official monetary trade statistics confirm persistent deficits:
- 2021: ¥1.8 trillion deficit
- 2022: ¥19.2 trillion deficit (record, energy crisis-driven)
- 2023: ¥9.8 trillion deficit
- 2024: ¥5.5 trillion deficit (44% improvement from 2023)
The 44% reduction in monetary trade deficit from 2023 to 2024 significantly outpaced the container ratio improvement (~6% improvement), confirming that value density shifts favor Japan's trade position. This suggests Japan successfully increased the value-per-container of exports while reducing the cost-per-container of imports (particularly energy), even though container volume ratios remain unfavorable.
Quarterly Trade Balance Volatility
Examining quarter-by-quarter trade balance data reveals substantial volatility overlaying the structural deficit trend:
Best Quarterly Performance (Smallest Deficit):
- Q2 2024: 125,888 TEU deficit (280,338 imports - 154,450 exports)
- Q1 2019: 128,600 TEU deficit (pre-pandemic best)
Worst Quarterly Performance (Largest Deficit):
- Q1 2022: 198,400 TEU deficit (energy crisis peak)
- Q4 2021: 193,200 TEU deficit (pandemic recovery import surge)
The ~70,000 TEU swing between best and worst quarters demonstrates how cyclical factors substantially impact Japan's trade position even within a persistent structural deficit framework. Q2 2024's relatively strong performance (smallest deficit since 2019) suggests the combination of export acceleration (+6.7% YoY) and import moderation (+3.1% YoY) can meaningfully narrow—though not eliminate—Japan's trade gap.
Seasonal patterns influence quarterly balance:
- Q1 typically shows larger deficits: Post-New Year import surge (Asian manufacturing restart, inventory rebuilding) combined with slower exports
- Q2 often shows improved balance: Fiscal year start (April) drives Japanese export push to establish annual sales trajectories
- Q3 mixed performance: Summer slowdowns offset by preparation for holiday season
- Q4 historically favorable: Year-end export surge to Western markets improves balance
However, 2023-2024 disrupted these seasonal patterns significantly. Q1 2024's exceptionally strong export growth (+10.7%) overwhelmed typical seasonal deficit-widening factors, suggesting structural shifts may be more important than seasonal patterns going forward.
Bilateral Balance Divergence
Japan's aggregate trade deficit conceals stark differences in bilateral balances with major partners:
Bilateral Surplus Countries:
- United States: ¥8.6 trillion surplus (2024), Japan's largest bilateral surplus
- Hong Kong: ¥1.2 trillion surplus (2024), entrepôt trade
- Thailand: ¥0.8 trillion surplus (2024), supply chain integration
- United Arab Emirates: ¥0.5 trillion surplus (2024), automotive exports
Bilateral Deficit Countries:
- China: ¥6.4 trillion deficit (2024), despite China being Japan's largest export market
- Australia: ¥3.2 trillion deficit (2024), energy and raw materials
- Saudi Arabia: ¥2.8 trillion deficit (2024), oil imports
- Qatar: ¥1.1 trillion deficit (2024), LNG imports
- Indonesia: ¥0.9 trillion deficit (2024), coal and LNG
This bilateral pattern reveals Japan's trade structure: substantial surpluses with developed markets (especially US) purchasing Japanese manufactured goods, offset by deficits with resource-rich nations supplying energy and raw materials. China represents an anomaly—Japan's largest trading partner generates deficit despite high-value Japanese exports, indicating scale of Japanese imports from China's manufacturing sector.
The Japan-US surplus remains strategically sensitive. At ¥8.6 trillion ($57.4 billion), this bilateral imbalance represented a key point of contention in 2025 US-Japan trade negotiations, with the US seeking greater market access to narrow the gap. Container data suggests automotive exports drove most of the Japan-US surplus, making this sector vulnerable to US policy pressure.
Structural Factors Perpetuating Deficit
Several interconnected structural factors ensure Japan will likely maintain trade deficits for the foreseeable future:
Irreducible Energy Dependency: Japan's island geography and lack of domestic energy resources create permanent import dependency for ~90% of energy needs. Even with maximum nuclear restarts and renewable deployment, Japan will import vast quantities of LNG, oil, and coal indefinitely. These energy imports alone exceed Japan's export capacity to many markets.
Food Security Vulnerability: At 38% food self-sufficiency, Japan must import grains, meat, dairy, and processed foods to feed its population. Agricultural imports—while modest in container terms—represent significant value and are growing as domestic agriculture declines (aging farmer population, abandonment of rural farmland).
Manufacturing Offshoring: Japanese manufacturers have shifted production overseas extensively. A Toyota built in Kentucky or Thailand doesn't contribute to Japanese exports but may generate Japanese imports (components flowing TO Japan for domestic market). This "hollowing out" erodes Japan's export base while potentially increasing imports.
Demographic Decline Impact: Japan's shrinking, aging population reduces the workforce available for export-oriented manufacturing while simultaneously (and paradoxically) maintaining import demand for elderly care products, medical equipment, and pharmaceuticals. The demographic structure shifts trade composition unfavorably.
Service Sector Deficit: Container data captures goods trade but misses services. Japan runs persistent services deficits (tourism spending by Japanese traveling abroad, licensing fees for foreign technology, transportation services) that compound merchandise trade challenges.
Currency Policy Constraints: Bank of Japan's ultra-low interest rate policy (maintained to support debt servicing and stimulate domestic demand) has contributed to yen weakness. While weak yen theoretically helps exports, Japan's export pricing structure (many contracts denominated in destination currency) and import dependencies mean net effect has been negative for trade balance.
Trade Balance Outlook: Gradual Improvement Likely
Despite structural headwinds, several factors suggest Japan's trade deficit will continue gradually narrowing from 2024's ¥5.5 trillion toward potential balance by 2026-2027:
Favorable Factors:
- Export momentum sustained by semiconductor equipment demand
- Automotive sector recovery from chip shortage constraints
- Energy import costs declining from 2022-2023 peaks
- Tourism recovery (services exports) improving services balance
- Potential yen strengthening if BOJ normalizes policy reducing import costs
Unfavorable Factors:
- Slowing Chinese economy threatening Japan's largest export market
- US-Japan trade tensions potentially constraining automotive exports
- Geopolitical risks (Taiwan, South China Sea) disrupting supply chains
- Domestic demand weakness limiting export-oriented manufacturing
- Energy price volatility risk (Middle East tensions)
Container data trajectory—improving from 2.11:1 ratio (2022) to 1.91:1 (2024)—suggests gradual rebalancing is underway. Extrapolating this trend conservatively projects:
- 2025: 1.85:1 ratio, ¥3.5-4.0 trillion deficit
- 2026: 1.78:1 ratio, ¥1.5-2.5 trillion deficit
- 2027: 1.72:1 ratio, near-balance or small deficit
This optimistic scenario requires sustained export growth (+5-7% annually) and continued import moderation (0-2% annually). Any significant economic shock—energy price surge, financial crisis, major geopolitical disruption—would derail this trajectory.
Realistically, Japan's trade position will likely oscillate around small deficits (¥2-4 trillion) rather than achieving sustained surpluses given its structural import dependencies. Container ratios suggest achieving better than 1.7:1 (41% more imports than exports) is unlikely without dramatic structural economic transformation.
Port Infrastructure and Logistics
Japan's Major Container Ports
Japan's container trade flows through a network of sophisticated port facilities, with five major ports dominating:
1. Port of Tokyo (JPTYO)
Japan's largest container port by volume handled approximately 4.8 million TEUs in 2024 (estimated based on partial-year data showing 2.42 million TEUs in first half of 2025, +6.5% YoY growth trajectory).
Tokyo's strategic position serving the Greater Tokyo Area—home to 38 million people and Japan's economic heart—makes it indispensable for Japan's trade. The port handles diverse cargo: consumer goods imports for Tokyo's retail market, automotive exports from nearby factories, and high-value electronics/semiconductor equipment.
Recent statistics show Tokyo Port's resilience: Q3 2024 volumes reached record levels despite global shipping disruptions, with container throughput increasing across both imports (202,664 TEUs, +6.0%) and exports (155,169 TEUs, +3.5%).
2. Port of Yokohama (JPYOK)
Japan's second-largest port handled approximately 4.2 million TEUs in 2024. Located adjacent to Tokyo, Yokohama serves as overflow capacity and specializes in automotive exports (Nissan, Mitsubishi facilities nearby) and general consumer goods imports.
Third quarter 2024 data showed Yokohama processing 237,988 TEUs (up 3.4% YoY), with exports at 126,093 TEUs (+4.9%) and imports at 111,895 TEUs (+1.8%)—a more balanced mix than most Japanese ports.
3. Port of Nagoya (JPNGO)
Strategically located in Japan's industrial heartland (Aichi Prefecture, home to Toyota), Nagoya handled approximately 4.4 million TEUs in 2024. Total cargo throughput reached 157 million tons (down 0.7% from 2023), indicating some weakness in bulk cargo offsetting container growth.
Nagoya's role as Toyota's primary export hub makes it critical for Japan's automotive trade. The port's extensive automotive terminal facilities can process thousands of vehicles daily for export to global markets.
4. Port of Kobe (JPKOB)
Historically one of Japan's most important ports, Kobe handled approximately 3.0 million TEUs in 2024. The port has gradually ceded market share to Tokyo and Yokohama as shipping lines optimize hub networks, but remains vital for Osaka-Kyoto-Kobe industrial belt.
Kobe specializes in breakbulk cargo, Roll-on/Roll-off (RoRo) services for vehicles, and containerized exports from Kansai region manufacturers.
5. Port of Osaka (JPOSA)
Osaka Port processed approximately 2.5 million TEUs in 2024, serving Japan's second-largest metropolitan area. The port handles significant volumes of consumer goods imports for Kansai region (Osaka, Kyoto, Nara, 20+ million population) and exports from regional manufacturers.
Aggregate Japanese Port Performance (2024):
- Total container throughput (all Japanese ports): ~20-22 million TEUs estimated
- Japan's "Big Six" ports (Tokyo, Yokohama, Nagoya, Kobe, Osaka, plus Fukuoka): ~18 million TEU
- Year-over-year growth: +2-3% estimated (modest recovery from pandemic disruptions)
Japan Federation of International Freight Forwarders Associations (JIFFA) reported that Japan's 12 major ports handled 3.89 million TEUs in Q3 2024 alone, up 0.6% year-on-year, confirming the container data's modest growth trajectory.
Port Capacity Constraints and Competitiveness Challenges
Despite sophisticated infrastructure, Japanese ports face competitiveness challenges relative to regional rivals (Shanghai, Busan, Singapore):
Capacity Limitations: Japanese ports generally operate at 70-80% capacity utilization, below the 85-90% optimal range that maximizes efficiency without causing congestion. This underutilization reflects Japan's shrinking trade volumes relative to rapidly growing Asian neighbors.
Productivity Gaps: Japanese ports' container handling productivity lags global leaders:
- Tokyo Port: ~55-65 container moves per hour per crane
- Yokohama: ~50-60 moves per hour
- Global leaders (Singapore, Shanghai):** 80-100 moves per hour
The productivity gap stems from multiple factors: labor practices emphasizing safety over speed, older gantry crane equipment at some facilities, and complex customs procedures requiring more dwell time.
Transshipment Competition: Japan lost significant transshipment business to South Korea's Busan Port (which handles 22+ million TEUs annually) and Singapore (37+ million TEUs). Japanese ports primarily serve origin-destination cargo (imports FOR Japan, exports FROM Japan) rather than transshipment cargo being transferred between vessels. This transshipment loss reduces scale economies and increases per-container handling costs, making Japanese ports less attractive to global shipping lines routing vessels across Pacific and Asia-Europe routes.
Feeder Service Challenges: Japan's geography—archipelago spread across 3,000 km—requires extensive domestic feeder networks connecting smaller regional ports to major hubs. These additional transshipment costs make Japanese logistics more expensive than competitors with concentrated coastal populations.
Labor Cost Disadvantage: Japanese port labor costs significantly exceed regional competitors. Unionized dockers at Japanese ports earn 2-3x wages of counterparts in Chinese or Southeast Asian ports, directly impacting handling charges passed to shippers.
The "2024 Problem" and Labor Shortage Impact
Japan's logistics sector confronted the so-called "2024 Problem"—new overtime restrictions on truck drivers that took effect April 2024, severely constraining trucking capacity just as ports needed to move containers from docks to inland destinations.
The 2024 Problem compounded existing driver shortages (average truck driver age exceeds 50, young workers avoid profession) and created port congestion as containers accumulated at terminals awaiting truck pickup. Some Japanese shippers began utilizing South Korea's Busan Port as an alternative, trucking containers across Korea to transship via Busan rather than using congested Japanese ports with insufficient trucking capacity.
Port authorities responded with extended gate hours, improved appointment systems, and initiatives to expand rail container service (less affected by driver shortage). However, the 2024 Problem exposed Japan's logistics vulnerabilities and may have contributed to modest import growth in 2024 as supply chain managers sought to minimize inventory subject to delivery delays.
Port Digitalization and Efficiency Initiatives
Japanese ports have pursued digitalization initiatives to improve competitiveness:
Port Community Systems (PCS): ACCS (Nippon Automated Cargo and Port Consolidated System) integrates customs clearance, terminal operations, and logistics coordination digitally. However, adoption of advanced features remains incomplete compared to Singapore's Calista or Rotterdam's Portbase systems.
Automated Container Terminals: Several Japanese ports invested in automated guided vehicles (AGVs), automated stacking cranes, and remote-controlled equipment. Tokyo Port's Ohi Terminal and Yokohama's South Terminal incorporated automation, but full-scale automated terminals (like Shanghai's Yangshan Phase IV) remain future projects.
Blockchain and Data Sharing: Pilot projects testing blockchain-based documentation sharing and smart contracts aim to reduce paperwork processing time. However, these remain limited pilots rather than full deployment.
Green Port Initiatives: Japan mandated shore power connections for vessels at berth (reducing emissions from auxiliary engines) and promoted LNG-fueled harbor tugboats. Environmental performance improvements position Japanese ports favorably for shippers prioritizing sustainability.
Infrastructure Investment Outlook
Japan's Ministry of Land, Infrastructure, Transport and Tourism (MLIT) allocated ¥500+ billion for port infrastructure modernization in 2024-2026 budgets, focusing on:
- Deepening berths to accommodate larger container vessels (24,000+ TEU "megaships")
- Expanding automated terminal capacity
- Improving intermodal rail connectivity
- Strengthening port resilience against earthquakes/tsunamis (critical following 2011 Tohoku disaster)
However, Japan's constrained fiscal position (government debt exceeds 260% of GDP) limits available infrastructure investment, and ports compete with other pressing needs (aging infrastructure replacement, disaster prevention, healthcare).
Container data suggests Japanese port volumes will likely grow only 1-3% annually in coming years—insufficient to justify massive expansion projects. Instead, focus will remain on efficiency improvements and automation to handle flat-to-modest volume growth with fewer workers (addressing demographic labor shortage).
Economic Policy Context and Currency Dynamics
Bank of Japan Monetary Policy Shifts (2024)
Japan's trade performance in 2024 occurred against backdrop of historic monetary policy changes. The Bank of Japan, after decades of ultra-loose policy, began tentative normalization:
March 2024: BOJ ended negative interest rate policy, raising short-term rates from -0.1% to 0-0.1%. This marked the first rate increase in 17 years and termination of yield curve control policy that had suppressed long-term interest rates.
July 2024: Second rate hike to 0.25%, accompanied by announcement of balance sheet reduction (quantitative tightening). This aggressive move shocked financial markets and triggered yen carry trade unwinds.
December 2024: BOJ held rates at 0.25% despite hawkish signals, citing need to assess global economic conditions and domestic wage growth.
These policy shifts aimed to address yen depreciation that had reached 38-year lows (161.96 per dollar in July 2024) and threatened imported inflation. The rate hikes, combined with direct currency intervention by Ministry of Finance, successfully strengthened yen from 162 to approximately 145 per dollar by year-end 2024.
Yen Depreciation Impact on Trade
The yen's dramatic 50% depreciation from 103 per dollar (end-2020) to 160+ per dollar (mid-2024) profoundly affected Japan's trade dynamics:
Export Impact (Complex):
Theoretical economics suggests weak currency boosts export competitiveness. However, Japan's export impact was muted because:
- Many Japanese exports are priced in foreign currency based on global market rates (not yen-adjusted)
- Substantial Japanese production has moved overseas (weak yen doesn't help foreign-produced goods)
- Export contracts often locked in pricing months in advance, delaying yen movement benefits
Container data showing 7.3% export growth in 2024 likely reflects yen depreciation benefits to some degree, though difficult to isolate from other factors (semiconductor demand surge, automotive backlog clearing).
Import Impact (Severe):
Yen weakness unambiguously increased import costs. Energy imports priced in dollars became substantially more expensive in yen terms, contributing to consumer price inflation. Container data showing only 1.2% import volume growth suggests yen-driven price increases destroyed demand—Japanese consumers and businesses reduced import purchases as yen cost surged.
The asymmetric impact—limited export boost, severe import cost inflation—explains why BOJ intervened despite traditional preference for weak yen. The net effect was damaging to Japanese living standards even as it modestly improved trade balance.
Wage Growth and Domestic Demand
Japan's chronic deflation finally transitioned to modest inflation in 2023-2024, with consumer prices rising 3.0-3.5% annually. This prompted Japan's first meaningful wage negotiations in decades:
Spring 2024 Wage Negotiations (Shunto):
Major Japanese corporations agreed to largest wage increases since 1991:
- Toyota: 7.6% wage increase
- Honda: 7.4% wage increase
- Average across major firms: 5.1% wage increase
These substantial wage gains aimed to support domestic consumption and ensure inflation remained driven by demand rather than only import costs. However, real wages (adjusted for inflation) rose only modestly, constraining consumption growth.
Container import data's 1.2% growth suggests wage gains were insufficient to drive robust domestic demand recovery. Japanese households remained cautious, prioritizing saving over consumption amid economic uncertainty.
"Abenomics" Legacy and Structural Reform Challenges
Japan's economic policy framework from 2012-2020 ("Abenomics") pursued "three arrows": monetary easing, fiscal stimulus, and structural reform. While the first two were implemented aggressively, structural reforms largely failed:
Unrealized Structural Reforms:
- Labor market flexibility (remains rigid with lifetime employment norms)
- Women's workforce participation (improved but below potential)
- Immigration policy (modest relaxation but far from needs)
- Corporate governance (some improvements but family-controlled firms remain common)
- Agricultural liberalization (highly protected sector resists reform)
- Service sector productivity (lags manufacturing significantly)
These structural rigidities constrain Japan's ability to adjust to shifting global trade dynamics. Container data revealing persistent trade deficits reflects not just cyclical factors but failure to address fundamental economic structure issues.
Trade Policy and Geopolitical Positioning
Japan's 2024 trade performance occurred within complex geopolitical environment:
US-Japan Trade Relations: Bilateral trade negotiations throughout 2024-2025 focused on automotive trade (US pressure to reduce Japan's surplus) and agricultural market access (US farmers seeking greater access to protected Japanese market). The ¥8.6 trillion bilateral surplus remained contentious.
China-Japan Economic Interdependence vs. Strategic Competition: Despite security tensions over Taiwan and maritime territorial disputes, China-Japan economic relationship remained substantial. Container data's export strength was partly China-driven (semiconductor equipment). However, both nations pursued gradual supply chain diversification.
Regional Trade Agreements: Japan participated actively in RCEP (Regional Comprehensive Economic Partnership) and remained committed to TPP-11 (now CPTPP). These regional frameworks provided tariff advantages for Japanese exports to member nations, supporting export growth.
Semiconductor Export Controls: Japanese cooperation with US export controls on advanced semiconductor equipment to China created economic costs (foregone Chinese sales) but strengthened US-Japan strategic alignment. This policy trade-off prioritized geopolitics over short-term economics.
Sector-Specific Deep Dives
Automotive Sector: Export Powerhouse Under Pressure
Japan's automotive sector remains central to export performance, yet faces existential challenges:
2024 Production and Export Statistics:
- Domestic production: 4.42 million vehicles (down 7.5% from 2023)
- Exports: 4.0 million vehicles (down 2.5% from 2023)
- Domestic sales: 4.42 million vehicles (down 6.7% from 2023)
Despite production decline, container data showed strong automotive export growth (+13,180 TEUs for mid-size cars alone). This apparent contradiction resolves when considering that production decline was concentrated in domestic-market vehicles and small exports, while high-volume export categories (mid-size and large passenger cars) maintained output.
Japan's Automotive Trade Position (2024):
- Exports to US: 1.5 million vehicles (~$45 billion value)
- Exports to Middle East: 800,000 vehicles (~$18 billion value)
- Exports to Europe: 500,000 vehicles (~$15 billion value)
- Exports to Australia: 300,000 vehicles (~$8 billion value)
Japanese automakers' global production structure shows ongoing shift: 2024 overseas production exceeded 18 million vehicles while domestic production fell below 4.5 million—a 4:1 ratio. This "hollowing out" means most "Japanese" vehicles sold globally are no longer exported from Japan.
Electric Vehicle Transition Challenges:
Japan's comparative slowness in electric vehicle adoption creates strategic risk:
- Japan EV share of domestic sales: ~3.5% (2024)
- China EV share: ~37% (2024)
- Europe EV share: ~22% (2024)
Japanese automakers' hybrid-heavy strategy (Toyota particularly) bet against rapid full-EV transition. If global markets accelerate toward EVs faster than Japan anticipated, Japanese automotive export competitiveness could erode dramatically. BYD (China) already outsells Japanese brands in several Southeast Asian markets.
Semiconductor Equipment: High-Tech Export Success Story
While automotive dominates container volumes, semiconductor manufacturing equipment represents Japan's highest-value-per-container export category:
Japan's Global Semiconductor Equipment Position (2024):
- Tokyo Electron: World #3 semiconductor equipment maker (~$20 billion sales)
- Advantest: #1 in semiconductor test equipment (~$3 billion sales)
- Screen Holdings: #1 in wafer cleaning equipment (~$2.5 billion sales)
- KOKUSAI ELECTRIC: Leading thermal processing equipment
- Nikon: Lithography equipment (though eclipsed by ASML)
Japanese semiconductor equipment sales grew 27% in 2024 to approximately ¥4.0 trillion ($26.7 billion), with China accounting for ~35% of sales despite export control restrictions. This sector's strength drove substantial portion of Japan's export growth captured in container data.
Technology Leadership Position:
Japan maintains leadership in specific niche semiconductor processes:
- Wafer cleaning and surface preparation (Screen Holdings: 70% global market share)
- Deposition equipment for advanced nodes (Tokyo Electron: competitive with US Applied Materials)
- Semiconductor test systems (Advantest: 50%+ market share)
- Specialty materials (photoresists, silicon wafers, specialty gases)
However, Japan's semiconductor equipment industry faces threats: US export controls limiting sales to China (largest customer), ASML's EUV lithography monopoly (Japanese lithography equipment can't compete at leading edge), and potential Chinese domestic equipment development reducing future demand for imports.
Chemical Industry: Steady Export Foundation
Japan's chemical industry—less visible than automotive or electronics—provides consistent export revenues:
Major Japanese Chemical Exports (2024):
- Plastics and synthetic resins: ~$25 billion exports
- Organic chemicals: ~$18 billion exports
- Specialty chemicals (pharmaceutical intermediates, electronic chemicals): ~$15 billion
- Synthetic rubber: ~$4 billion
These chemicals support global manufacturing supply chains, particularly in automotive (resins, coatings), electronics (photoresists, etching chemicals), and pharmaceuticals (active pharmaceutical ingredients). Container data captured portion of these exports in various HS code categories.
Japanese chemical companies (Mitsubishi Chemical, Sumitomo Chemical, Mitsui Chemicals, Toray) operate globally with production facilities worldwide, though high-value specialty chemicals continue to be produced domestically and exported.
Machinery and Industrial Equipment
Japan's machinery sector represents diverse export strength across construction equipment, factory automation, robots, and industrial components:
Major Machinery Export Categories:
- Industrial robots (Fanuc, Yaskawa, Kawasaki Heavy Industries)
- Construction machinery (Komatsu, Hitachi Construction, Kobelco)
- Machine tools (DMG Mori, Okuma, Mazak)
- Pumps, compressors, and industrial equipment
- Precision instruments and measuring equipment
Container data's export growth likely included significant machinery shipments, though specific HS code granularity limits precise attribution. Japanese machinery exports benefit from reputation for reliability, precision, and longevity—commanding price premiums despite higher costs than Chinese or South Korean alternatives.
However, China's rapid advancement in industrial machinery threatens Japan's market position. Chinese construction equipment (XCMG, Sany) and industrial robots increasingly compete on technology as well as price.
Future Outlook and Strategic Implications
Short-Term Projections (2025-2026)
Container data trends and economic indicators suggest Japan's trade trajectory for next 2-3 years:
Base Case Scenario (65% probability):
- Export growth moderates to 3-5% annually (from 2024's 7.3%)
- Import growth remains subdued at 1-3% annually
- Container import/export ratio improves gradually to ~1.85:1 by 2026
- Monetary trade deficit narrows to ¥2-3 trillion range
- GDP growth modest 1.0-1.5% annually
This scenario assumes no major economic shocks, continued Chinese demand for Japanese goods despite slower Chinese growth, automotive export market stability, and modest yen strengthening supportive of purchasing power without devastating export competitiveness.
Optimistic Scenario (20% probability):
- Export growth accelerates to 6-8% annually (semiconductor equipment boom sustains, automotive EVs successful)
- Import growth remains under 2% (successful domestic energy production, weak consumption)
- Container ratio improves to 1.75:1 by 2026
- Trade deficit eliminated or small surplus achieved
- GDP growth 2.0-2.5% driven by export strength
This requires multiple positive factors aligning: technological leadership maintained in semiconductors and advanced manufacturing, successful EV transition capturing market share, significantly higher wage growth driving productivity gains, and global economic expansion maintaining demand for Japanese exports.
Pessimistic Scenario (15% probability):
- Export growth turns negative (-2% to 0%) as Chinese economy deteriorates and US imposes tariffs
- Import growth rebounds to 4-6% as energy prices surge and yen collapses
- Container ratio worsens to 2.0:1+
- Trade deficit expands back toward ¥8-10 trillion
- GDP stagnates or contracts
This scenario involves global recession, renewed energy crisis, collapse of semiconductor equipment exports to China due to export controls, US trade barriers against Japanese automotive exports, or major yen depreciation episode triggering imported inflation without export benefits.
Medium-Term Structural Challenges (2027-2035)
Looking beyond immediate cyclical factors, Japan confronts fundamental structural challenges:
Demographic Collapse:
Japan's working-age population (15-64) is projected to decline from 75 million (2024) to 68 million (2035)—a loss of 7 million workers in just 11 years. This labor force contraction directly constrains export manufacturing capacity while reducing domestic consumption (hence import demand).
Even with aggressive automation and robotics adoption, Japan's demographic trajectory makes sustained export growth increasingly difficult. Container data's export volumes may have peaked in 2020s and face declining trajectory through 2030s unless dramatic productivity improvements materialize.
Technological Competition:
China's rapid advancement across manufacturing technologies threatens Japan's export competitiveness:
- Chinese EVs surpassing Japanese vehicles in technology and cost
- Chinese semiconductor equipment progressing (albeit still years behind leading edge)
- Chinese industrial automation and robotics reaching quality parity
- Chinese high-speed rail technology competing globally
Japan's historical technological advantage—critical to export success—is eroding across multiple sectors. Maintaining technology leadership will require dramatically increased R&D spending (currently ~3.3% of GDP, needs to reach 4%+) and attraction/retention of global scientific talent (challenging given language barriers and immigration restrictions).
Energy Transition Imperative:
Japan's 90% energy import dependency becomes increasingly untenable as global energy markets undergo transition. Japan needs either:
- Massive renewable energy deployment (solar, wind, offshore wind) to reduce fossil fuel imports
- Comprehensive nuclear reactor restarts (currently only ~10 of 54 pre-Fukushima reactors operating)
- Development of hydrogen economy (Japan pursuing this but technology remains expensive)
Failure to address energy dependency leaves Japan perpetually vulnerable to commodity price shocks and geopolitical supply disruptions. Container data's import volumes remain elevated partly due to energy-related trade; solving energy challenges could substantially improve trade balance.
Service Sector Productivity Crisis:
Japan's service sector productivity lags manufacturing sector by massive margins. Retail, hospitality, healthcare, education sectors operate with 1970s-1980s productivity levels, employing large workforces producing modest output. This service sector inefficiency:
- Absorbs workers who could be in export manufacturing
- Creates high costs for domestic businesses (reducing export competitiveness)
- Limits wage growth and consumption (affecting import demand)
Service sector reform—deregulation, digitalization, consolidation—could free resources for export sectors, but faces resistance from vested interests.
Geopolitical Constraints and Opportunities
Japan's trade future intertwines inseparably with geopolitical evolution:
US-China Strategic Competition:
Japan's position between its largest trading partner (China) and primary security ally (US) creates increasing tension. Export controls, supply chain restrictions, and technology transfer limitations force Japanese companies to choose between markets or develop duplicate supply chains—both costly approaches.
Container data's strong semiconductor equipment exports to China in 2024 may represent a peak, as tightening US controls compel Japanese companies to reduce China exposure. This could subtract 3-5% from potential export growth over next 5 years.
ASEAN Economic Integration:
Alternatively, Japan's deep economic integration with Southeast Asian nations (ASEAN) offers opportunities. Japanese FDI in Thailand, Vietnam, Indonesia creates supply chain networks generating two-way trade flows. Container data captured some of this intra-Asian trade; further ASEAN development could partially offset China risks.
Indo-Pacific Regional Frameworks:
CPTPP, RCEP, and potential expanded regional trade agreements could reduce tariff barriers and improve market access for Japanese exports. However, limited evidence suggests these agreements dramatically alter trade patterns versus underlying economic fundamentals.
Climate Change and Sustainability Pressures
Environmental regulations and climate change concerns will increasingly affect trade patterns:
Carbon Border Adjustments: Europe's carbon border adjustment mechanism (CBAM) and potential similar measures elsewhere will affect Japanese exports. Japan's relatively clean energy manufacturing (despite importing energy) may provide modest advantages versus coal-dependent competitors.
Green Technology Exports: Japan's strengths in hybrid vehicles, hydrogen technology, carbon capture, and environmental equipment position it potentially well for growing markets in climate mitigation technologies. Container data may increasingly reflect exports of batteries, hydrogen fuel cells, and environmental equipment.
Supply Chain Resilience vs. Efficiency: Climate change-driven disruptions (extreme weather, sea level rise affecting ports, agricultural disruptions) will prioritize supply chain resilience over pure efficiency. Japan's diversified supplier base and high-quality domestic manufacturing could become advantages as "just-in-time" gives way to "just-in-case."
Conclusion: Trade Rebalancing Amid Structural Transformation
Japan's 2024 container trade data reveals a nation navigating complex transition between established industrial strengths and emerging economic challenges. The 7.3% export growth achieved in 2024's first three quarters, contrasted against 1.2% import growth, demonstrates that Japan retains formidable export capabilities—particularly in automotive manufacturing and semiconductor equipment—even as structural trade deficits persist.
The gradual improvement of Japan's container trade ratio from 2.11:1 (2022 peak deficit) to 1.91:1 (2024) signals that Japan's worst trade imbalance period may be past. Combined with the 44% reduction in monetary trade deficit from 2023 to 2024 (¥9.8 trillion to ¥5.5 trillion), this suggests Japanese exporters successfully leveraged opportunities from yen depreciation, pent-up global demand, and technological leadership to improve national trade position.
However, this analysis must be tempered by acknowledgment of persistent structural vulnerabilities:
- Energy dependency locking Japan into perpetual large-scale imports regardless of export success
- Demographic decline constraining future production capacity and export potential
- Technological competition from Chinese and South Korean manufacturers eroding traditional advantages
- Manufacturing offshoring shifting production overseas and reducing Japan's export base
- Service sector inefficiencies creating economic drag that limits overall competitiveness.
The container-level data examined herein—spanning 5,072 import HS codes and 3,709 export HS codes across eight years—provides granular visibility into the physical flows of goods that underpin Japan's trade statistics. While these container volumes don't perfectly correlate with monetary trade values (high-value semiconductors occupy few containers while low-value commodities are volume-intensive), the container data illuminates critical patterns about Japan's manufacturing activity, supply chain dependencies, and export competitiveness.
Key findings synthesized across this analysis:
1. Export Growth Leadership: Automotive sector (+13,180 TEU growth in mid-size passenger cars alone) and semiconductor equipment drive Japan's export resurgence, demonstrating continued global demand for Japanese manufactured goods.
2. Import Moderation: Modest 1.2% import growth reflects successful energy consumption reduction, yen-driven demand destruction, and economic weakness constraining consumption.
3. Bilateral Trade Divergence: Large surplus with US (¥8.6 trillion) offset by deficits with China (¥6.4 trillion) and resource exporters, highlighting Japan's role as intermediary—importing raw materials and components, adding value through manufacturing, exporting finished goods to developed markets.
4. Structural Deficit Persistence: Despite improvement, Japan's 1.91:1 import/export container ratio indicates trade deficits will likely persist indefinitely given irreducible dependencies on imported energy and food.
5. Port Infrastructure Adequacy: Japan's major ports (Tokyo, Yokohama, Nagoya, Kobe, Osaka) handle trade volumes efficiently though facing competitiveness challenges versus lower-cost regional rivals. Capacity is sufficient for projected modest growth.
6. Currency Impact Complexity: Yen depreciation from 103 to 160 per dollar (2020-2024) produced asymmetric effects—limited export boost, substantial import cost inflation—challenging simplistic assumptions about currency weakness benefiting export nations.
7. Policy Effectiveness Mixed: Bank of Japan's monetary policy normalization and Ministry of Finance currency interventions helped stabilize yen and reduce trade deficits, though structural reforms needed to address underlying competitive challenges remain largely unimplemented.
Looking forward, Japan's container trade trajectory will depend critically on three intersecting factors: **sustaining technological leadership** in semiconductors, advanced manufacturing, and emerging sectors (hydrogen, robotics, environmental tech); **successfully navigating** US-China strategic competition to maintain market access in both spheres; and **implementing domestic structural reforms** addressing demographics, service sector productivity, and energy dependency.
The base case projection suggests Japan's trade position continues gradually improving through 2026-2027, with container import/export ratios reaching ~1.85:1 and monetary deficits settling around ¥2-3 trillion—manageable levels that don't threaten economic stability but indicate Japan no longer generates large trade surpluses that characterized its 1980s-2000s economic prime.
Achieving more dramatic trade improvement requires either breakthrough technological dominance (Japan becomes indispensable supplier of critical technologies), major geopolitical realignment shifting global trade patterns in Japan's favor, or successful economic revitalization domestically driving both productivity gains and renewed innovative capacity. None of these scenarios appears imminent, suggesting Japan's trade future is one of gradual managed decline rather than dynamic resurgence or catastrophic collapse.
For global supply chain managers, logistics professionals, and trade policy analysts, Japan's 2024 container data offers several practical implications:
- Japanese reliability remains advantage: Despite challenges, Japanese manufacturers continue delivering quality products on schedule, maintaining supply chain value
- Automotive sector concentration creates vulnerability: Over-reliance on automotive exports exposes Japanese trade to sector-specific shocks
- Semiconductor equipment dependency concerns: Heavy reliance on China market for chip equipment exports creates geopolitical risk
- Yen volatility requires hedging: Wild currency swings (160 to 145 per dollar in months) necessitate robust currency risk management
- Port congestion risks modest: Unlike LA/Long Beach crisis or Chinese COVID shutdowns, Japanese ports remain reliable with minimal congestion
- Long-term diversification advised: Gradual structural weakening suggests supply chains overly dependent on Japanese sources should develop alternatives
The VIZION ocean booking data analyzed throughout this report provides invaluable real-time visibility into trade flows that official statistics capture only with months of lag. Container-level granularity enables identification of emerging trends (automotive export surge in Q1 2024, soybean import collapse) months before they appear in government reports, offering actionable intelligence for supply chain decision-making.
Japan's trade performance in 2024 ultimately reflects a mature industrial economy leveraging accumulated technological capabilities and manufacturing expertise to maintain relevance in increasingly competitive global markets. The country's ability to sustain export growth while gradually reducing structural trade deficits demonstrates resilience and adaptability. Yet the mounting challenges—demographic crisis, technological competition, geopolitical tensions, energy vulnerability—suggest Japan's trade success requires continuous evolution rather than reliance on historical advantages.
Whether Japan successfully navigates this transition from 20th-century export powerhouse to 21st-century technology leader, or gradually cedes market share to rising competitors, will determine not just national trade statistics but the economic prospects of 125 million Japanese citizens for decades to come. The container data from 2024 captures one year in this multi-decade journey—a year of modest success and cautious optimism, but with awareness that fundamental challenges remain unresolved.
---
Methodology and Data Limitations
This analysis relies primarily on VIZION ocean booking container data spanning Q4 2017 through Q3 2024, covering 5,072 unique import HS codes and 3,709 unique export HS codes. The data captures actual ocean freight bookings processed through VIZION's API platform, providing visibility into containerized goods flows.
Data Strengths:
- Real-time visibility: Container booking data available weeks to months before official customs statistics
- HS code granularity: Product-level detail enables identification of specific categories driving trade trends
- Consistency: Uniform measurement methodology across time periods enables trend analysis
- Coverage: Captures majority of containerized goods trade (though excludes bulk shipping, air freight)
Data Limitations:
- Volume vs. Value: Container measurement (TEUs) reflects physical volume, not monetary value; high-value low-volume goods (semiconductors) underrepresented in container counts relative to economic importance
- Bulk Exclusion: Energy products (oil, LNG, coal—Japan's largest imports by value) ship via bulk carriers and tankers, not containers, creating incomplete picture of total trade
- Air Freight Missing: High-value, time-sensitive goods (electronics, pharmaceuticals, precision instruments) often ship by air rather than ocean, missing from container data
- Sampling: VIZION captures significant share but not 100% of ocean bookings; data represents robust sample rather than complete census
- Quarterly Aggregation: Quarterly summaries smooth out monthly volatility, potentially obscuring short-term trends
Cross-Validation Approach:
To address these limitations, this analysis cross-references VIZION container data against official statistics from:
- Japanese Ministry of Finance (customs trade statistics)
- Bank of Japan (balance of payments data)
- Japan External Trade Organization (JETRO reports)
- Sector-specific sources (JAMA for automotive, SEAJ for semiconductors, JIFFA for port statistics)
Where container data diverges from official statistics, this analysis notes discrepancies and offers explanations. Generally, container data trends align closely with official volume statistics while differing predictably in value-based measures.
HS Code Classification: The analysis references Harmonized System codes as provided in source data. HS codes at higher aggregation levels (2-digit, 4-digit) represent broad product categories, while 6-digit and 8-digit codes provide specific product detail. Readers should exercise caution when comparing HS codes across different classification systems (HS2012, HS2017, HS2022) as codes evolve over time.
Currency Conversions: Where yen-denominated statistics are converted to dollars, this analysis uses approximate exchange rates (¥145/$1 for 2024 figures unless otherwise specified). Currency volatility during the analysis period means dollar-equivalent values are approximate.
Projection Caveats: Forward-looking statements about 2025-2026 trade trajectories represent analysis-based projections, not forecasts, and are subject to massive uncertainty from macroeconomic shocks, policy changes, geopolitical events, and technological disruptions. Readers should treat projections as illustrative scenarios rather than predictions.
---
**Report Author Note:** This analysis was prepared based on VIZION ocean container booking data and publicly available trade statistics. While every effort has been made to ensure accuracy, readers should independently verify specific data points before making business or policy decisions. Trade statistics are frequently revised as preliminary data is updated; figures herein reflect data available as of publication date.The insights, conclusions, and recommendations in this report represent independent analysis and do not constitute official positions of Japanese government agencies, international organizations, or commercial entities mentioned. This report is intended for informational and educational purposes only.
%20-%202026-07-17T152701.754.png)
%20-%202026-07-17T104412.520.png)
%20-%202026-07-08T100322.158.png)


