

%20-%202025-12-03T153155.821.png)
Comprehensive Analysis of Key Trade Trends, Regional Shifts, and Strategic Implications
VIZION API Trade Intelligence Analysis
Published: November 25, 2025
Executive Summary
Global container trade demonstrated remarkable resilience in 2025, achieving 3.5-4.2% growth and decisively outperforming pessimistic early-year forecasts that predicted flat or negative growth. This comprehensive analysis combines VIZION's ocean booking platform data—representing approximately 45% of global containerized trade validated against official Container Trade Statistics (CTS)—with industry forecasts from leading analysts to provide actionable insights for 2026.
2025 Key Achievement: Container volumes reached 126.75 million TEU (Jan-Aug), marking 4.4% year-over-year growth despite unprecedented tariff implementations, geopolitical tensions, and supply chain reconfigurations.
2026 Outlook: Forward booking data and industry consensus point to 3% demand growth against 3.6% fleet capacity expansion, creating shipper-favorable market conditions with expected freight rate declines of 10-25% across different contract types.
Geographic Power Shift: Traditional trade patterns are being rewritten as China redirects exports from tariff-impacted U.S. markets toward Europe (+10-15%), Africa (+20-25%), and intra-Asian lanes (+6-8%), while emerging markets—led by India, Philippines, and East Africa—accelerate their rise.
Understanding VIZION's Data: Coverage and Methodology
Data Validation Against Official Statistics
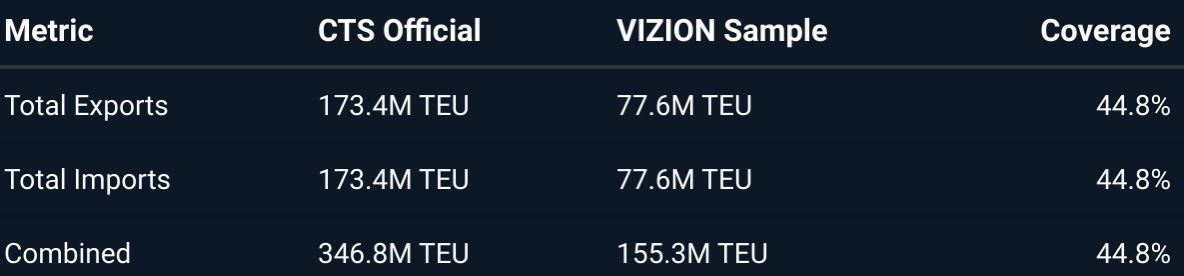
VIZION's booking platform data has been rigorously validated against Container Trade Statistics (CTS), the authoritative source for global container trade data. This validation confirms that VIZION captures a statistically significant sample of global trade flows.
2023 Baseline Comparison:
Country-Level Coverage Variation:
- High Coverage (60-80%): Congo (77%), Australia (61%)
- Moderate Coverage (30-40%): China (33%), major developed markets
- Lower Coverage (<20%): Myanmar (15%), smaller emerging markets
What This Means for Analysis:
- VIZION data provides directional indicators and relative trends rather than absolute volumes
- The ~45% sample size is statistically robust for identifying shifts in booking patterns
- Early visibility advantage: Booking data reveals demand expectations approximately 6-8 weeks before container arrivals
- Country-specific forecasts combine VIZION booking trends with CTS official growth rates for accuracy
The Booking Window Phenomenon
Understanding the natural booking timeline is critical for interpreting forward-looking data:
2026 Forward Bookings (as of late November 2025):
- Q1 2026: 10,069,346 TEU (6-8 weeks advance booking window)
- Q2 2026: 27,904 TEU (booking window just opening)
- Q3 2026: 912 TEU (minimal advance bookings)
- Q4 2026: 158 TEU (no meaningful bookings yet)
Critical Interpretation: The dramatic Q1-to-Q4 taper is normal and expected, reflecting standard industry booking practices where shippers commit to space 6-8 weeks prior to shipment. The robust Q1 2026 volume (10.1M TEU) represents approximately 6-7% of expected global quarterly trade, consistent with VIZION's market coverage.
What Q1 2026 Bookings Reveal:
- Shipper confidence in early 2026 demand remains stable
- No panic signals or demand collapse indicators
- Booking pace suggests Q1 2026 tracking toward 145-150 million TEU globally (3-4% above Q1 2025)
- Carriers allocating space normally, indicating balanced supply-demand expectations
2025 Performance: Defying the Pessimists
Global Volume Growth Exceeded Expectations
Official Statistics Confirm Strong Performance:
- Jan-Aug 2025: 126.75 million TEU (+4.4% YoY)
- August 2025: Record monthly volume of 16.61 million TEU
- Full-year 2025 trajectory: 3.5-4.2% growth
Context of Achievement: Early 2025 industry forecasts predicted -1% to +1% growth due to:
- U.S. tariff implementation fears
- Expected inventory destocking
- Geopolitical uncertainty (Red Sea, China-Taiwan tensions)
- Post-pandemic demand normalization
What Actually Happened:
- Front-loading surge: U.S. importers accelerated shipments ahead of tariff implementations
- China's pivot: Chinese exporters successfully redirected volumes to Europe, Africa, and ASEAN markets
- Resilient demand: European and Asian consumer demand proved stronger than expected
- E-commerce growth: Continued 5-8% annual expansion in parcel/container demand
- Inventory restocking: After cautious 2024, companies rebuilt safety stocks
VIZION Booking Data (2025):
- Export bookings: 88.0 million TEU
- Import bookings: 88.0 million TEU
- Total: 176 million TEU in advance bookings (+1.5% vs 2024 patterns)
The performance gap between pessimistic forecasts and actual results underscores the value of real-time booking data for early demand detection.
Regional Performance: Winners and Losers of 2025
Fastest-Growing Markets Validated by CTS Official Data
Using official Container Trade Statistics growth rates (2020-2023 CAGR), we identify the markets that sustained momentum through 2025:
Export Growth Champions:
- Nigeria: 23.0% CAGR (232,304 TEU in 2023)
- Oil & gas equipment, agricultural products, minerals
- Infrastructure development driving logistics capacity
- Oil & gas equipment, agricultural products, minerals
- Togo: 21.7% CAGR (97,220 TEU)
- Regional transshipment hub for West Africa
- Port of Lomé expansion creating gateway effect
- Cambodia: 13.4% CAGR (440,705 TEU)
- Textile/garment exports booming
- "China+1" manufacturing beneficiary
- Philippines: 12.3% CAGR (1,465,000 TEU) ⭐
- Electronics manufacturing expansion
- Semiconductor component exports
- Tanzania: 12.5% CAGR (236,458 TEU)
- East Africa gateway role expanding
- Mining and agricultural exports containerizing
- India: 7.7% CAGR (6,900,383 TEU) ⭐
- "China+1" manufacturing surge
- Electronics, pharmaceuticals, automotive components
Import Growth Leaders:
- Georgia: 16.3% CAGR (322,373 TEU)
- Caucasus trade corridor development
- Infrastructure project imports
- Honduras: 15.8% CAGR (272,492 TEU)
- Central American nearshoring beneficiary
- Consumer goods and equipment imports
- Central American nearshoring beneficiary
- Philippines: 15.2% CAGR (3,163,149 TEU) ⭐
- Growing middle class consumption
- Electronics manufacturing equipment
- India: 14.6% CAGR (7,011,587 TEU) ⭐
- Massive infrastructure development
- Manufacturing input imports
- Iraq: 13.5% CAGR (1,093,021 TEU)
- Reconstruction and development needs
- Oil revenue supporting imports
- Tanzania: 12.0% CAGR (529,580 TEU)
- Landlocked country gateway (Uganda, Rwanda, Burundi, DRC)
- Consumer goods and equipment for development
⭐ Dual Growth Stars: India, Philippines, and Tanzania demonstrate exceptional growth in both exports and imports, indicating comprehensive economic development rather than one-sided trade patterns.
Spotlight: The Three Stars of 2025
India: The Dual Powerhouse Accelerating
CTS Official Performance:
- 2023 Exports: 6.9 million TEU (+7.7% CAGR from 2020)
- 2023 Imports: 7.0 million TEU (+14.6% CAGR from 2020)
- Total Trade: 13.9 million TEU
- 2025 Update: Container cargo grew 11% in FY25, handling 351 million metric tons
Why India Stands Out:
- Only major economy with double-digit import CAGR (14.6%)
- Export CAGR (7.7%) outpaces most developed markets
- Simultaneous growth in both manufacturing exports AND consumer imports
- Infrastructure surge: Major port expansions boosting container handling capacity
Growth Drivers:
- "China+1" manufacturing: Companies diversifying supply chains to India
- Electronics boom: Smartphone, component, and semiconductor manufacturing
- Pharmaceuticals: India as global generic drug supplier
- Automotive: Both domestic production and export growth
- Consumer market: 1.4 billion population driving import demand
2025 Momentum: India's container traffic increased from 8.20 million TEU (FY16) to 12.28 million TEU (FY24), with acceleration continuing through 2025.
VIZION Booking Insight: Quarter-over-quarter growth remained consistent throughout 2024-2025, with no signs of deceleration. Strong diversification across product categories reduces vulnerability to single-sector shocks.
Philippines: The Overlooked Growth Champion
CTS Official Performance:
- 2023 Exports: 1.46 million TEU (+12.3% CAGR)
- 2023 Imports: 3.16 million TEU (+15.2% CAGR)
- Total Trade: 4.62 million TEU
- August 2025 Update: Railway cargo container exports surged +17.4% YoY
Why Philippines Deserves Attention:
- Highest combined growth rates (12.3% export + 15.2% import) among major Asian markets outside China/Vietnam
- Balanced development: Strong export manufacturing AND robust consumer imports
- Strategic location: Gateway position in Southeast Asian supply chains
- Young demographic: Growing middle class fueling consumption
Growth Engines:
- Electronics manufacturing: Semiconductors, components, assembly operations
- Business Process Outsourcing (BPO): Infrastructure and logistics needs
- Consumer goods imports: Expanding middle class driving demand
- Regional integration: ASEAN supply chain participation
VIZION Insight: Booking data shows sustained momentum with quarter-over-quarter acceleration through 2025, suggesting continued expansion into 2026.
Tanzania: East Africa's Gateway
CTS Official Performance:
- 2023 Exports: 236,458 TEU (+12.5% CAGR from 2020)
- 2023 Imports: 529,580 TEU (+12.0% CAGR from 2020)
- Total Trade: 766,038 TEU
VIZION Booking Data: Shows even higher growth rates (46.4% YoY in 2024), suggesting accelerating momentum beyond CTS historical trends.
Strategic Importance:
- Gateway role: Serving landlocked countries (Uganda, Rwanda, Burundi, Democratic Republic of Congo)
- Port of Dar es Salaam: Major expansion underway
- Mining exports: Copper, gold, and minerals increasingly containerized
- Consumer imports: Growing population and economic development
Regional Context:
- Africa container traffic: Grew 57% in recent years (second only to Asia's 64%)
- Kenya comparison: 188,748 TEU exports in 2023 (+6.8% CAGR)
- Intra-African trade: Growing 12.4% YoY (2024)
- Infrastructure investments: Both Tanzania and Kenya receiving major port/railway upgrades
Why This Matters: Tanzania and Kenya are emerging as Africa's logistics hubs, playing a similar role to Singapore and Hong Kong in Asia during their development phases.
The Tariff Impact: Reshaping Global Trade Flows
U.S. Import Dynamics and Front-Loading Patterns
2025 U.S. Reality:
- Full-year 2025 forecast: 24.1 million TEU (down 5.6% from 25.5M in 2024)
- Cause: Tariff implementations driving inventory pullback and sourcing shifts
- Pattern: Sharp volatility throughout the year
VIZION Booking Data Reveals Three Distinct Phases:
- Early 2025 (Q1-Q2): Front-loading surge (+15-20% above normal)
- Shippers accelerating shipments ahead of tariff deadlines
- Record booking volumes in anticipation of higher costs
- Mid-2025 (Q3): Sharp correction (-10 to -15%)
- Inventory levels reached capacity
- Tariffs fully implemented, eliminating urgency
- Late 2025 (Q4): Stabilization at new baseline
- Adjusted booking patterns at post-tariff equilibrium
- No further declines, suggesting floor reached
Geographic Redistribution: U.S. import reduction didn't translate to global decline—it redistributed:
- Nearshoring surge: Mexico imports increased as China-direct reduced
- Longer supply chains: Some products still sourced from Asia but routed through intermediate countries
- Permanent shift: Some China-to-U.S. trade permanently lost to other destinations
China's Export Pivot: From West to World
The Diversification Strategy:
Faced with U.S. tariff barriers, Chinese exporters executed a remarkable geographic pivot in 2025:
VIZION Booking Data Shows Clear Redirection:
- U.S.-bound bookings: -8% to -12% vs 2024
- Europe-bound bookings: +10% to +15% vs 2024
- Africa-bound bookings: +20% to +25% vs 2024
- ASEAN-bound bookings: +6% to +8% vs 2024
- Net result: Flat to +2% total Chinese export volumes
New Priority Destinations:
- Europe (Primary):
- Absorbed majority of U.S.-diverted volumes
- Strong consumer demand for Chinese manufactured goods
- Infrastructure project equipment
- E-commerce parcel surge
- Africa (High Growth):
- Infrastructure development driving demand
- Consumer electronics and manufactured goods
- Construction equipment and materials
- Emerging market growth trajectory
- ASEAN (Regional Integration):
- Deeper supply chain integration
- Intermediate goods and components
- Consumer products for growing middle class
- Regional manufacturing network expansion
- Middle East:
- Infrastructure mega-projects
- Consumer goods imports
- Trade hub development (Dubai, Jeddah)
- Energy transition equipment
- Latin America:
- Brazil, Mexico, Chile as primary targets
- Agricultural equipment exports
- Consumer electronics and manufactured goods
- Growing bilateral trade agreements
Strategic Implication: China's successful export diversification demonstrates the resilience of manufacturing competitiveness. U.S. tariffs shifted trade flows but did not significantly reduce total Chinese export volumes.
2026 Forecast: Demand Growth vs. Capacity Oversupply
Demand Outlook: Moderate Growth Across Regions
Global Consensus: +3.0% container demand growth in 2026
Supporting Factors:
- Global GDP growth: 2.4-2.8% (WTO forecast)
- Manufacturing recovery: Gradual improvement in industrial production indexes
- Consumer spending: Stabilization in developed markets after inflation pressures ease
- E-commerce: Sustained 5-8% annual growth driving parcel/container demand
- Inventory cycles: Normal restocking patterns after 2024-2025 adjustments
Regional Variation in 2026 Demand:
- Asia-Pacific: +4-5% growth (leading global expansion)
- China: Moderate growth (+2-3%)
- India: Strong growth (+8-10%)
- Southeast Asia: Robust growth (+6-8%)
- Japan/Korea: Modest growth (+1-2%)
- Europe: +2-3% growth (modest recovery)
- Absorbing China's redirected exports
- Manufacturing gradual improvement
- Green transition equipment imports
- North America: +1-2% growth (post-tariff stabilization)
- U.S. import baseline adjustment complete
- Nearshoring from Mexico continuing
- Canada steady performance
- Africa/Middle East: +8-12% growth (emerging markets)
- Infrastructure development boom
- Intra-African trade expansion
- Consumer market growth
- Latin America: +3-4% growth (nearshoring benefits)
- Mexico manufacturing expansion
- Brazil agricultural exports
- Regional trade integration
Supply-Side Challenge: Overcapacity Returns
Fleet Capacity Growth: +3.6% in 2026
The Mathematics of Overcapacity:
- New vessel deliveries: 1.7 million TEU (2026)
- Reduced from 2025: Down from 2.1 million TEU delivered in 2025
- Scrapping minimal: Young fleet age profile limits retirement
- Result: Supply (+3.6%) exceeding demand (+3.0%) = 0.6% overcapacity
Historical Context:
- 2024: Undersupply due to Red Sea diversions
- 2025: Balanced supply-demand (capacity absorbed by longer routes)
- 2026: Return to overcapacity as Red Sea normalizes (base case)
Implications of Overcapacity:
- Downward pressure on freight rates
- Carrier profitability challenges
- Shipper negotiating leverage strengthens
- Service quality competition intensifies
- Potential for carrier consolidation or exits
Carrier Response Strategies:
- Aggressive blank sailings (canceled voyages)
- Slow steaming to reduce effective capacity
- Alliance coordination for capacity management
- Cost optimization programs
- Service differentiation beyond price
UNCTAD Warning: "Maritime trade growth set to stall" with freight rates remaining volatile amid geopolitical tensions and structural overcapacity.
Freight Rate Outlook: Advantage Shippers
2026 Rate Predictions from Leading Analysts
Long-term Contract Rates:
- Xeneta forecast: -10% decline vs 2025 levels
- Range: 10-15% reduction expected across major lanes
Spot Rates:
- Xeneta forecast: -25% decline vs 2025 average
- Volatility: High variability expected due to geopolitical events
- Trend: Downward trajectory but episodic spikes likely
Why Rates Will Fall:
- Structural Overcapacity:
- Supply growth (+3.6%) outpacing demand growth (+3.0%)
- Carrier order book still historically high
- Limited scrapping creates persistent capacity surplus
- Competition Intensifies:
- Multiple carriers competing for market share
- New capacity entrants in some markets
- Alliance dynamics creating competitive pressure
- Normalization of Routes:
- Red Sea expected to stabilize (base case)
- Panama Canal water level improvements
- Shorter routing reduces fuel costs and time
- Shipper Leverage:
- Space availability not a constraint
- Multiple carrier options on major lanes
- Stronger negotiating position in annual tenders
- Economic Headwinds:
- Moderate global GDP growth limiting demand acceleration
- Tariff uncertainty reducing willingness to stockpile
- Just-in-time inventory practices returning
Xeneta Official Outlook: "Overall lower long term and short term rates in 2026 as overcapacity continues to plague carriers."
Fitch Ratings: "Container shipping profits set to decline significantly in 2025-2026 from 2024 levels."
Risk Factors That Could Spike Rates
Upside Rate Risks (rates higher than forecast):
- Geopolitical Shocks (60% probability of some impact):
- Red Sea/Suez Canal renewed disruptions
- South China Sea tensions escalating
- Ukraine/Russia conflict expansion
- Taiwan Strait crisis
- Impact: Regional disruptions, longer routes, capacity absorbed
- Weather/Climate Events (50% probability):
- Panama Canal drought recurrence
- Hurricane/typhoon season severity
- Port damage from extreme weather
- Impact: Temporary capacity constraints, route changes, delays
- Labor Disruptions (30% probability):
- Port worker negotiations/strikes
- Trucking capacity constraints
- Warehouse labor shortages
- Customs/inspection slowdowns
- Impact: Congestion, delays, localized rate impacts
- Carrier Capacity Discipline (40% probability):
- Aggressive blank sailings
- Alliance-coordinated slow steaming
- Vessel idling programs
- Impact: Artificial capacity reduction supporting rates
- Demand Surge (20% probability):
- Sudden inventory restocking wave
- Economic recovery exceeding forecasts
- E-commerce acceleration
- Impact: Temporary tight capacity, spot rate spikes
Low-Probability, High-Impact Wild Cards:
- Major Carrier Bankruptcy (10-15% probability): Overcapacity + low rates could force weaker carriers to exit, creating temporary capacity shortage and rate spikes of 50-100%
- Pandemic 2.0 (5-10% probability): New global health crisis repeating the demand collapse then surge pattern
- Suez/Panama Complete Closure (5% probability): Geopolitical or natural disaster would reroute 15-20% of global trade, spiking rates 200-300%
Probability Assessment: 20-30% chance of sustained rate spike (>20% increase) at some point in 2026 due to one or more risk factors materializing.
Trade Lane Analysis: Where 2026 Growth Will Occur
Asia-Europe: The 2026 Growth Leader
Forecast: +5-6% growth
Volume: ~13-14 million TEU (2026 estimated)
Why Asia-Europe Will Outperform:
- China export redirection: U.S.-diverted volumes flowing to Europe
- European demand stabilization: Consumer spending recovering from inflation shock
- Manufacturing components: Automotive, electronics, machinery flows
- E-commerce surge: Parcel volumes growing 8-10% annually
- Southeast Asia-Europe: Vietnam, Thailand, Philippines exports increasing
Challenges:
- Red Sea/Suez Canal situation remains uncertain
- Potential for longer Cape of Good Hope routing
- Rate volatility if disruptions recur
- Environmental regulations adding costs
Carrier Strategy: Capacity reallocation from Transpacific to Asia-Europe already underway in Q4 2025.
Transpacific: Post-Tariff New Normal
Forecast: +1-2% growth
Volume: ~23-24 million TEU (2026 estimated)
Stabilization Factors:
- U.S. import growth constrained but not collapsing
- Tariff baseline adjustment complete
- Nearshoring reducing some Asia-direct volumes
- Inventory levels normalized, limiting restocking surge
Dynamics:
- Eastbound (Asia to U.S.): Modest growth as tariff impact fully priced in
- Westbound (U.S. to Asia): Continued weakness, persistent imbalance
- Equipment positioning: Empty container repositioning challenges persist
VIZION Insight: Booking data shows stabilization at post-tariff baseline with no further declines expected. Q1 2026 bookings tracking ~2% above Q1 2025.
Intra-Asia: The Hidden Giant
Forecast: +6-8% growth
Volume: ~45-47 million TEU (2026 estimated)
Why Intra-Asia Matters:
- Largest trade lane globally by volume (often overlooked in media coverage)
- Exceeds Transpacific + Asia-Europe combined
- Fastest-growing major trade corridor
- Resilient to U.S.-China tensions
Growth Drivers:
- China-Southeast Asia integration: Supply chain deepening
- Regional manufacturing networks: Components, intermediate goods
- E-commerce explosion: Cross-border parcels booming
- Consumer markets expanding: India, Indonesia, Philippines, Vietnam
- Infrastructure development: Belt and Road Initiative projects
Key Sub-Lanes:
- China-Southeast Asia (dominant flow)
- Northeast Asia-Southeast Asia (Korea, Japan, Taiwan to ASEAN)
- Intra-ASEAN (regional trade within Southeast Asia)
- India-Southeast Asia (growing rapidly)
Strategic Implication: Companies focused solely on Transpacific miss the world's largest growth opportunity in intra-Asian trade.
Emerging Markets: Africa, Latin America, Middle East
Forecast: +8-12% growth
Combined Volume: ~15-17 million TEU (2026 estimated)
Africa (Double-digit growth expected):
- Infrastructure development driving imports
- Mining/agricultural exports accelerating
- Intra-African Continental Free Trade Area (AfCFTA) implementation
- Key markets: Nigeria, Tanzania, Kenya, South Africa, Egypt
- Chinese investment creating new trade corridors
Latin America (Nearshoring beneficiary):
- Mexico manufacturing expansion (+10-15% forecast)
- Brazil agricultural exports remaining strong
- Chile copper/lithium containerization increasing
- Central America-U.S. trade growing (Honduras, Guatemala, El Salvador)
- Regional integration (Mercosur, Pacific Alliance)
Middle East (Infrastructure boom):
- Gulf state mega-projects (Saudi Vision 2030, UAE diversification)
- E-commerce rapid growth
- Regional trade hub development (Dubai, Jeddah expanding)
- Energy transition equipment imports
- Turkey serving as Europe-Middle East bridge
Common Themes:
- Young, growing populations
- Infrastructure investment waves
- Natural resource exports modernizing
- Manufacturing capacity building
- Consumer markets expanding
Country-Specific 2026 Forecasts
United States
Import Forecast: 24.5-25.0 million TEU (+1.6% to +3.7% vs 2025)
Export Forecast: Modest decline continues
2026 Scenario:
- Tariff impacts fully absorbed by mid-2026
- Consumer spending moderate growth (+2-3%)
- E-commerce sustaining baseline demand
- Nearshoring reducing import intensity
- Inventory practices returning to just-in-time
VIZION Forward Booking Signal: Q1 2026 bookings show stabilization at new baseline with no catastrophic decline. Shipper sentiment: cautious but stable.
China
Export Forecast: +2-3% growth
Import Forecast: +3-4% growth
Strategy for 2026:
- Geographic diversification entrenched (less U.S. dependence)
- Focus on ASEAN, EU, Africa, Latin America markets
- Domestic consumption supporting import growth
- Manufacturing sophistication increasing (moving up value chain)
- Belt and Road Initiative creating new trade corridors
CTS Context: China maintained 44.4 million TEU exports (2023), defending dominant global position despite U.S. tensions.
India
Export Forecast: +8-10% growth
Import Forecast: +10-12% growth
2026 Target: 15-16 million TEU total container trade
Momentum Factors:
- "China+1" manufacturing gains accelerating
- Electronics production scaling rapidly
- Infrastructure investments boosting port capacity
- Consumer market expanding (middle class growth)
- Government "Make in India" policies supporting manufacturing
Sectors Driving Growth:
- Exports: Electronics, pharmaceuticals, automotive components, textiles
- Imports: Manufacturing equipment, raw materials, consumer electronics, energy equipment
Infrastructure Context: Major port expansions at JNPT, Mundra, Chennai, Visakhapatnam increasing container handling capacity by 20-30% over next two years.
Philippines
Export Forecast: +10-12% growth
Import Forecast: +12-15% growth
2026 Target: 5.0-5.2 million TEU total trade
Growth Engines:
- Electronics manufacturing (semiconductors, components) expanding rapidly
- Business Process Outsourcing (BPO) sector infrastructure needs
- Middle class consumption surge (population 115+ million)
- Strategic position in regional supply chains
- Government infrastructure investments
Competitive Advantages:
- English-speaking workforce
- Young demographic (median age 26)
- Strategic location for Southeast Asian trade
- Improving port and logistics infrastructure
European Union
Combined Import Forecast: +2-3% growth
Combined Export Forecast: +3-4% growth
2026 Dynamics:
- Absorbing China's redirected export volumes
- Manufacturing sector gradual recovery
- Green transition equipment imports (renewable energy, electric vehicles)
- Intra-EU trade remaining robust
- Logistics hub concentration (Rotterdam, Hamburg, Antwerp, Genoa)
Key Countries:
- Germany: Manufacturing recovery, automotive transition
- Netherlands: Logistics hub role expanding
- Belgium: Antwerp port growing market share
- Spain/Italy: Mediterranean trade gateway importance
East Africa: Tanzania and Kenya
Combined Growth Forecast: +15-20%
2026 Target: 1.5-1.7 million TEU combined
Transformation Underway:
- Major port expansions (Dar es Salaam, Mombasa capacity doubling)
- Landlocked country gateway role expanding (Uganda, Rwanda, Burundi, DRC, South Sudan)
- Mining exports increasingly containerized (copper, gold, minerals)
- Consumer goods imports surging with economic development
- Infrastructure investments (Standard Gauge Railway in Kenya)
Regional Impact:
- Tanzania: Serving southern landlocked corridor
- Kenya: Serving northern landlocked corridor
- Competition and cooperation: Both ports complementary rather than purely competitive
- Intra-African trade: Growing 12-15% annually
Strategic Implications for Supply Chain Professionals
For Shippers: 2026 Is Your Year
Market Position: Shipper-favorable environment with carrier overcapacity creating unprecedented negotiating leverage.
Negotiating Power Factors:
- Overcapacity = shipper leverage
- Space availability guaranteed on major lanes
- Multiple carrier options for competitive bidding
- Service level commitments attainable
- Rate pressure working in shippers' favor
Strategic Recommendations:
- Lock in Multi-Year Contracts Early (Q1 2026)
- Target 10-15% reductions vs 2025 rates
- Overcapacity window may not last beyond 2026
- Multi-year agreements provide budget certainty
- Include volume flexibility clauses
- Diversify Carrier Base
- Maintain 3-4 carrier relationships per major lane
- Avoid over-dependence on single carrier/alliance
- Create competitive tension in negotiations
- Build backup capacity for disruption resilience
- Invest in Visibility Technology
- Real-time tracking (platforms like VIZION) essential for optimization
- Predictive ETAs reduce inventory carrying costs
- Exception management enables proactive problem-solving
- Data analytics identify cost-saving opportunities
- Build Routing Flexibility
- Prepare alternative routings for major lanes
- Consider all-water vs. intermodal options
- Evaluate transshipment hub alternatives
- Plan for Red Sea/Panama Canal contingencies
- Strategic Spot Market Usage
- Use spot market for non-core lanes (rates attractive)
- Maintain contract backbone for core volume
- Opportunistic spot buying during rate troughs
- Digital freight platforms for spot sourcing
- Sustainability Requirements
- Include carbon reporting in carrier contracts
- Evaluate ECO-delivery options (slower but cheaper and greener)
- Prepare for emerging carbon taxes and regulations
- Track Scope 3 emissions for ESG reporting
For Carriers: Margin Pressure Intensifies
Operating Environment: Profitability challenges from overcapacity, rate pressure, and rising compliance costs.
Survival Strategies:
- Capacity Discipline
- Aggressive blank sailings on weak lanes
- Alliance coordination for capacity management
- Slow steaming to reduce effective capacity and fuel costs
- Strategic vessel idling if necessary
- Cost Optimization
- Operational efficiency programs essential
- Fuel consumption reduction technologies
- Port operation efficiency improvements
- Administrative cost reductions
- Service Differentiation
- Reliability over price competition (on-time performance)
- Premium services for time-sensitive cargo
- Digital customer experience enhancements
- Transparent communication and proactive exception management
- Value-Added Services
- Beyond basic port-to-port transportation
- Customs brokerage and compliance
- Warehousing and distribution services
- Supply chain visibility and analytics platforms
- Cargo insurance and trade finance
- Strategic Partnerships
- Alliance strengthening for network coverage
- Terminal operator collaborations
- Technology platform integrations
- Customer co-innovation programs
- Environmental Leadership
- Alternative fuel adoption (LNG, methanol, ammonia)
- Fleet modernization for efficiency
- Carbon offset programs
- Regulatory compliance ahead of mandates
For Freight Forwarders: Volume Over Margin
Market Reality: Rate compression reducing margins, requiring volume growth and efficiency to maintain profitability.
Winning Tactics:
- Expand Emerging Market Presence
- Establish operations in Africa, Southeast Asia
- Local partnerships in high-growth markets
- Cultural and regulatory expertise development
- First-mover advantages in underpenetrated markets
- Digital Platform Investment
- Customer self-service portals
- Real-time visibility and tracking
- Automated booking and documentation
- API integrations with customer systems
- Mobile applications for on-the-go management
- Specialized Expertise Development
- E-commerce fulfillment and last-mile
- Perishables and temperature-controlled
- Oversized and project cargo
- Hazardous materials handling
- Industry-specific solutions (automotive, pharmaceuticals, fashion)
- Carrier Relationship Management
- Build strong partnerships for space protection during tight markets
- Volume commitments for preferential rates
- Collaborative planning for capacity needs
- Multi-carrier strategies for flexibility
- Total Landed Cost Solutions
- Beyond freight: duties, taxes, compliance, insurance
- Supply chain consulting and optimization
- Inventory management and warehousing
- Customs clearance and trade compliance
- Risk management and cargo insurance
- Sustainability Services
- Carbon footprint reporting for customers
- Green logistics consulting
- Modal optimization for emissions reduction
- Compliance with customer ESG requirements
Technology and Sustainability Trends Shaping 2026
Digital Transformation Acceleration
Real-Time Visibility: From Advantage to Requirement
- Platforms like VIZION becoming table stakes
- Customers demand sub-hour data updates
- Predictive analytics for ETA forecasting
- Exception management and proactive problem-solving
- Integration with ERP and TMS systems
AI and Machine Learning Applications:
- Route optimization algorithms
- Demand forecasting models
- Dynamic pricing engines
- Predictive maintenance for equipment
- Fraud detection and compliance screening
Blockchain for Documentation:
- Digital bills of lading pilots expanding
- Smart contracts for automated payments
- Immutable audit trails for compliance
- Interoperability standards emerging (TradeLens, GSBN)
API Integration Ecosystems:
- Seamless data exchange between platforms
- Real-time booking and documentation
- Automated customs clearance
- Financial settlements and payments
- IoT sensor data integration
Impact on Competition: Companies without robust digital infrastructure falling behind competitively. Technology investment no longer optional for market relevance.
Green Shipping Regulations and Compliance
2026 Environmental Milestones:
- EU Carbon Border Adjustment Mechanism (CBAM):
- Fully implemented for container shipping
- Importers must report and pay for embedded carbon
- Affects goods entering EU from outside
- Favors low-carbon shipping options
- IMO 2023 Strategy Implementation:
- Greenhouse gas reduction requirements tightening
- Carbon Intensity Indicator (CII) ratings affecting vessel employment
- Energy Efficiency Existing Ship Index (EEXI) compliance mandatory
- Trajectory toward 2030 targets (-40% carbon intensity)
- Alternative Fuel Adoption Accelerating:
- LNG: Growing but transitional fuel
- Methanol: Several carriers deploying methanol-capable vessels
- Ammonia: Pilot projects beginning
- Biofuels: Blending increasing
- Future: Hydrogen and synthetic fuels on horizon
- Slow Steaming:
- Environmental tool (reduces emissions 20-30%)
- Overcapacity management tool (reduces effective capacity)
- Trade-off: Longer transit times
- Optimal speed becoming key efficiency metric
Cost Impact: Green compliance adding 5-10% to carrier operating costs, increasingly passed through to shippers via environmental surcharges or higher base rates.
Shipper Considerations:
- Carbon reporting requirements for Scope 3 emissions
- Customer and investor pressure for sustainable shipping
- Potential competitive advantage from green credentials
- Trade-offs between cost, speed, and environmental impact
E-Commerce Evolution and Impact
Growth Trajectory: E-commerce driving +5-8% annual growth in parcel and container demand, exceeding traditional trade growth.
Characteristics Transforming Supply Chains:
- Smaller shipment sizes: Less-than-container-load (LCL) growing
- Higher frequency: Weekly or daily shipments vs. quarterly bulk
- Diverse origin points: Direct from manufacturers vs. consolidated hubs
- Speed requirements: Express and time-definite services growing
- Returns complexity: Reverse logistics capabilities essential
- Last-mile challenges: Urban delivery and final-mile costs
Impact on Container Trade:
- Traditional FCL (full container load) growth slower
- LCL consolidation services expanding
- Air-sea hybrid services (sea to regional hub, air to final destination)
- More frequent but smaller container shipments
- Fulfillment center placement driving new trade patterns
Regional E-Commerce Hotspots:
- China: World's largest e-commerce market, driving exports of parcels globally
- Southeast Asia: Explosive growth (Indonesia, Vietnam, Philippines, Thailand)
- India: Domestic and international e-commerce booming
- Latin America: Brazil, Mexico leading regional growth
- Middle East: Gulf states high adoption rates
Supply Chain Implications: Need for faster, more flexible, more visible logistics networks optimized for smaller, more frequent shipments.
Risks and Wild Cards for 2026
High-Probability Risks (Significant Impact Likely)
Geopolitical Tensions (60% probability of trade impact)
Scenarios:
- Russia-Ukraine: Ongoing conflict affecting Black Sea trade, European supply chains
- China-Taiwan: Tensions could escalate, disrupting Asia-Pacific trade
- Middle East: Red Sea/Suez Canal instability, Israel-regional tensions
- Trade policy: U.S., EU, China tariff actions and counter-actions
Impact Assessment:
- Regional trade disruptions
- Route diversions (longer transits, higher costs)
- Rate volatility on affected lanes
- Cargo delay and uncertainty
- Insurance cost increases
Mitigation: Diversified routing, flexible carrier relationships, scenario planning, real-time monitoring
Weather and Climate Events (50% probability)
Scenarios:
- Panama Canal: Drought affecting draft restrictions and daily transits
- Hurricane/Typhoon Season: Port closures, vessel delays, infrastructure damage
- Extreme weather: Floods, storms affecting port operations globally
Impact Assessment:
- Temporary capacity constraints
- Route changes and delays
- Spot rate spikes during disruptions
- Cargo damage risks
- Port congestion
Mitigation: Alternative routing plans, weather monitoring systems, insurance coverage, flexible scheduling
Labor Disruptions (30% probability)
Scenarios:
- Port worker negotiations: East/Gulf Coast U.S. ports, European ports, Asian terminals
- Trucking capacity: Driver shortages, regulatory changes
- Warehouse labor: Shortages in key logistics hubs
- Customs/Border: Inspection slowdowns, processing delays
Impact Assessment:
- Port congestion and delays
- Equipment shortages (chassis, containers)
- Localized rate spikes
- Supply chain bottlenecks
- Customer service failures
Mitigation: Multi-port strategies, early booking, labor relations monitoring, contingency capacity
Medium-Probability Risks
Carrier Capacity Discipline Success (40% probability)
Scenario: Carriers successfully coordinate aggressive blank sailings, slow steaming, and vessel idling to artificially reduce capacity and support rates.
Impact: Rate decline forecasts prove too pessimistic; rates remain higher than expected or even increase.
Shipper Response: Early contract negotiations critical; don't delay assuming rates will fall.
Demand Surge (20% probability)
Scenario: Economic recovery exceeds forecasts, triggering inventory restocking wave or consumer spending boom.
Impact: Tight capacity, spot rate spikes, service failures, space allocation challenges.
Shipper Response: Maintain strong carrier relationships, contract commitments provide space protection.
Low-Probability, High-Impact Wild Cards
Major Carrier Bankruptcy or Exit (10-15% probability)
Scenario: Overcapacity and low rates squeeze weaker carriers' margins to unsustainable levels, forcing bankruptcy or market exit.
Impact:
- Immediate capacity shortage on affected routes
- Spot rates spike 50-100% short-term
- Cargo stranded or delayed
- Alliance restructuring
- Customer disruption and rebooking chaos
- Medium-term: Healthier competitive balance
Historical Precedent: Hanjin Shipping collapse (2016) created massive disruption.
Pandemic 2.0 or Major Health Crisis (5-10% probability)
Scenario: New global pandemic, emerging disease outbreak, or widespread health emergency.
Impact:
- Demand collapse in consumer goods
- Factory shutdowns disrupting supply
- Port closures and operational restrictions
- Subsequent demand surge creating whiplash
- Repeat of 2020-2021 volatility
Shipper Response: Agile supply chain design, inventory buffers for critical items, diversified sourcing.
Suez Canal or Panama Canal Complete Closure (5% probability)
Scenario: Geopolitical conflict, terrorism, natural disaster, or infrastructure failure closes critical chokepoint for extended period.
Impact:
- Suez: 15-20% of global trade rerouted via Cape of Good Hope (adding 10-14 days, 3,500+ nautical miles)
- Panama: Rerouting via Suez or Cape of Good Hope for Asia-East Coast U.S. trade
- Rates spike 200-300% on affected lanes
- Equipment shortages (containers stuck in wrong locations)
- Global ripple effects across all trade lanes
Historical Context: Ever Given grounding (2021) blocked Suez for 6 days, costing $10 billion per day in trade.
Conclusion: Navigating the 2026 Trade Landscape
The Bottom Line
2025 Performance: Resilience Demonstrated
- Achieved 3.5-4.2% growth despite tariff headwinds, geopolitical uncertainty, and supply chain reconfigurations
- Decisively outperformed pessimistic early-year forecasts of flat or negative growth
- August 2025 set new monthly record (16.61 million TEU)
- 126.75 million TEU Jan-Aug (+4.4% YoY) validates strong global trade momentum
2026 Outlook: Moderate Growth, Shifting Geography
- 3% global demand growth against 3.6% fleet capacity growth = shipper-favorable market
- Expected rate declines: Long-term contracts -10%, spot rates -25% (Xeneta forecast)
- Geographic winners: India (+8-10%), Philippines (+10-12%), East Africa (+15-20%), Intra-Asia (+6-8%)
- Stabilizing markets: U.S. (+1-2%), Europe (+2-3%)
- Strategic shift: Power moving from carriers to shippers, from mature to emerging markets
Market Dynamic Summary:
- Overcapacity creates negotiating leverage for shippers
- Rate pressure intensifies carrier margin squeeze
- Technology and sustainability becoming competitive differentiators
- Geographic diversification accelerating ("China+1", nearshoring, Africa rising)
- Trade patterns fundamentally reshaping (less U.S.-China, more Europe-Asia, more intra-regional)
Strategic Imperatives for 2026
For All Supply Chain Stakeholders:
- Lock in Favorable Economics Early (Q1 2026)
- Overcapacity window creates rare shipper advantage
- Multi-year contracts at 10-15% below 2025 rates achievable
- Window may close if carrier discipline succeeds or disruptions occur
- Early movers secure best terms before market adjusts
- Diversify Geographically and Operationally
- "China+1" sourcing strategies maturing (India, Vietnam, Mexico)
- Emerging markets offering growth opportunities (Africa, Southeast Asia)
- Route diversification reducing geopolitical risk
- Multi-carrier, multi-port strategies for resilience
- Invest in Real-Time Visibility and Data
- Visibility platforms (like VIZION) essential for optimization
- Predictive analytics reducing uncertainty and costs
- Real-time exception management preventing small problems from becoming large
- Data-driven decision making differentiating winners from laggards
- Build Flexibility into Operations
- Agile supply chains outperform rigid ones in volatile environment
- Routing optionality provides cost and risk management
- Carrier relationship diversity ensures space access
- Inventory strategies balancing cost vs. resilience
- Monitor Forward Indicators Continuously
- Booking data provides 6-8 week advance visibility
- Early detection of demand shifts enables proactive response
- Geopolitical and weather monitoring for disruption risks
- Rate trends and capacity utilization metrics guide timing
- Embrace Sustainability as Competitive Advantage
- Carbon regulations tightening (EU CBAM, IMO 2023 Strategy)
- Customer and investor ESG expectations rising
- Green credentials differentiating brands
- Early adopters gaining cost advantages as regulations mature
The Bigger Picture: Global Trade Power Shift
Fundamental Transformations Underway:
- From Carrier Power to Shipper Power:
- Decade of tight capacity (2020-2024) ending
- Overcapacity returning leverage to cargo owners
- Service quality competition replacing price dominance
- From Mature to Emerging Markets:
- Developed market growth modest (+1-3%)
- Emerging markets surging (+8-15%)
- Economic center of gravity shifting east and south
- Future growth in Asia, Africa, Latin America
- From U.S.-China Centricity to Multi-Polar Trade:
- U.S.-China trade declining as percentage of global total
- China diversifying to Europe, Africa, ASEAN
- Regional trade blocs strengthening (ASEAN, AfCFTA, USMCA)
- Intra-regional trade growing faster than inter-regional
- From Physical to Digital Supply Chains:
- Data visibility becoming as important as physical infrastructure
- AI and automation transforming operations
- Digital platforms enabling new business models
- Technology separating leaders from laggards
- From "Just-in-Time" to "Just-in-Case":
- Resilience valued alongside efficiency
- Strategic inventory buffers returning
- Nearshoring and friend-shoring strategies
- Supply chain redundancy as risk management
The Takeaway: Those who recognize and adapt to these structural shifts will thrive. Those clinging to pre-2020 trade patterns and practices will struggle. The global supply chain landscape of 2026 bears little resemblance to 2019—and the changes are permanent, not cyclical.
About This Analysis
Data Sources and Validation
Primary Data:
- VIZION API Booking Platform Data: 176 million TEU (2025), 10.1 million TEU (Q1 2026 forward bookings)
- Container Trade Statistics (CTS): Official global trade data, 346.8 million TEU (2023 baseline)
- Coverage Validation: VIZION represents 44.8% of global container trade (validated against CTS 2023)
Industry Forecasts:
- Xeneta: Ocean freight market intelligence and rate benchmarking
- Maersk: Global Market Update forecasts
- UNCTAD: United Nations maritime trade projections
- WTO: World Trade Organization global trade forecasts
- Fitch Ratings: Container shipping credit analysis
- CareEdge Ratings: India-specific container cargo forecasts
Validation Methodology:
- Cross-referenced VIZION booking patterns with CTS official growth rates
- Compared forward bookings (Q1 2026) with historical Q1 patterns
- Validated country-level trends with national port statistics
- Reconciled industry forecasts from multiple independent sources
- Adjusted for VIZION coverage percentage to estimate global volumes
Methodology and Interpretation
Booking Data Characteristics:
- Represents advance shipment commitments 6-8 weeks prior to container arrival
- Provides early visibility into demand expectations and shipper sentiment
- Subject to revisions, cancellations, and adjustments as circumstances change
- Best used for directional trends and relative comparisons rather than absolute volumes
2026 Forward Projections:
- Based on Q1 2026 bookings extrapolated using historical patterns
- Incorporates industry consensus forecasts for validation
- Country-level analysis combines VIZION booking trends with CTS official CAGR
- Regional forecasts triangulated across VIZION data, carrier outlooks, and analyst projections
Coverage Considerations:
- 44.8% global coverage provides statistically significant sample
- Country-level coverage varies (Congo 77%, China 33%, Myanmar 15%)
- Higher coverage in digitally-mature markets with advanced booking systems
- Lower coverage in cash markets or less digitized trade lanes
- Trends more reliable than absolute volumes due to coverage variation
About VIZION API
VIZION provides real-time container tracking and trade intelligence through normalized data integration from:
- Ocean container booking platforms (primary data source for this analysis)
- Electronic Data Interchange (EDI) feeds from carriers and terminals
- Automatic Identification System (AIS) vessel location data
- Port and terminal event notifications
- Railway connection data for inland transportation
Platform Capabilities:
- Sub-6-hour latency updates on container locations and status
- Predictive ETA calculations using machine learning
- Exception detection and proactive alerting
- Forward booking visibility (6-8 week advance window)
- API integration for seamless customer system connectivity
Client Base:
- Global freight forwarders and third-party logistics providers
- Beneficial cargo owners and shippers
- Supply chain visibility platform providers
- Trade finance and insurance companies
- Industry analysts and consultants
Disclaimer and Forward-Looking Statements
Data Accuracy:
This analysis is based on VIZION booking platform data representing approximately 45% of global container trade, validated against Container Trade Statistics official data. While VIZION data provides statistically significant directional indicators, it is not a complete census of global trade. Absolute volume figures should be considered estimates subject to revision.
Forward-Looking Statements:
2026 forecasts and projections are based on current booking data, historical patterns, and industry consensus as of November 2025. Actual results may vary significantly due to:
- Geopolitical events (conflicts, trade policy changes, sanctions)
- Economic conditions (GDP growth, consumer spending, manufacturing activity)
- Weather and climate events (hurricanes, droughts, natural disasters)
- Unforeseen disruptions (pandemics, infrastructure failures, labor strikes)
- Carrier behavior (capacity management, rate strategies, service changes)
Liability Limitation:
This analysis is provided for informational purposes only and should not be considered as:
- Financial advice or investment recommendations
- Contractual commitments or guarantees of future outcomes
- Comprehensive coverage of all relevant factors and risks
- Substitute for independent research and professional consultation
Official Statistics:
For definitive global trade statistics, consult national customs authorities, port statistics, and Container Trade Statistics (CTS) official publications.
Contact Information:
- Email: analytics@vizionapi.com
- Website: www.vizionapi.com
- Next Update: Quarterly analysis (March 2026)
%20-%202026-07-17T152701.754.png)
%20-%202026-07-17T104412.520.png)
%20-%202026-07-08T100322.158.png)


