


A Data-Driven Analysis of German Trade Trends, Industrial Challenges, and the Path Forward for Europe's Economic Engine
By Kyle Henderson, CEO of VIZION API
Published: November 25, 2025
Executive Summary
Germany's position as Europe's manufacturing powerhouse and export champion faces unprecedented challenges, as revealed by a comprehensive analysis of ocean container booking data and broader trade statistics. While official trade figures show Germany exported €1.56 trillion in goods during 2024—maintaining its position as the world's third-largest exporter—the underlying trends paint a more complex picture of an economy in transition.
Our analysis of VIZION API's ocean container booking data, combined with official German trade statistics, reveals five critical developments shaping Germany's trade landscape:
- Export Stagnation: Germany's exports declined 1.3% in 2024 compared with 2023, marking two consecutive years of contraction following decades of export-led growth
- Automotive Crisis: Car production plummeted from 5.6 million units in 2017 to 4.1 million in 2024, with over 50,000 jobs lost and exports to the U.S. down 8.6% in the first half of 2025
- China Trade Reversal: While China reclaimed its position as Germany's top trading partner, German exports to China fell 13.5% as Chinese domestic production displaced German imports
- Container Volume Shifts: Ocean booking data shows import container volumes surging 32.9% year-over-year in Q3 2024, contrasting with modest export volume growth of 6.5%—indicating shifts in product mix and logistics patterns even as Germany maintains a substantial trade surplus in value terms
- Manufacturing Recession: Industrial production posted its biggest decline in more than three years in August 2025, with machinery exports down 5% in 2024 and chemical industry facing structural challenges
This contraction represents more than cyclical weakness—it signals fundamental challenges to Germany's export-oriented growth model. High energy costs following the loss of cheap Russian natural gas, intensifying competition from Chinese manufacturers, trade policy uncertainties, and the automotive industry's troubled transition to electric vehicles converge to create what economists describe as a "perfect storm" for German trade.
The implications extend far beyond Germany's borders. As Europe's largest economy contributing 24% of EU GDP, Germany's trade challenges reverberate throughout European supply chains, port operations from Hamburg to Bremerhaven, and global manufacturing networks that depend on German machinery, vehicles, and industrial equipment.
The Numbers Tell a Complex Story: Diverging Trade Patterns
Germany's official 2024 trade statistics reveal an economy caught between competing forces. The country exported goods valued at €1,555.4 billion while importing €1,316.3 billion, generating a trade surplus of €239.1 billion—€21.4 billion higher than 2023's surplus. However, this superficially positive outcome masks deeper structural concerns.
2024 Full Year Performance:
- Exports: €1,555.4 billion (-1.3% vs 2023)
- Imports: €1,316.3 billion (-3.0% vs 2023)
- Trade Surplus: €239.1 billion (+9.8% vs 2023)
*Figure 1: Germany's official trade statistics show exports declining for two consecutive years while the trade surplus grows—a pattern indicating domestic demand weakness rather than export strength. Source: Destatis*
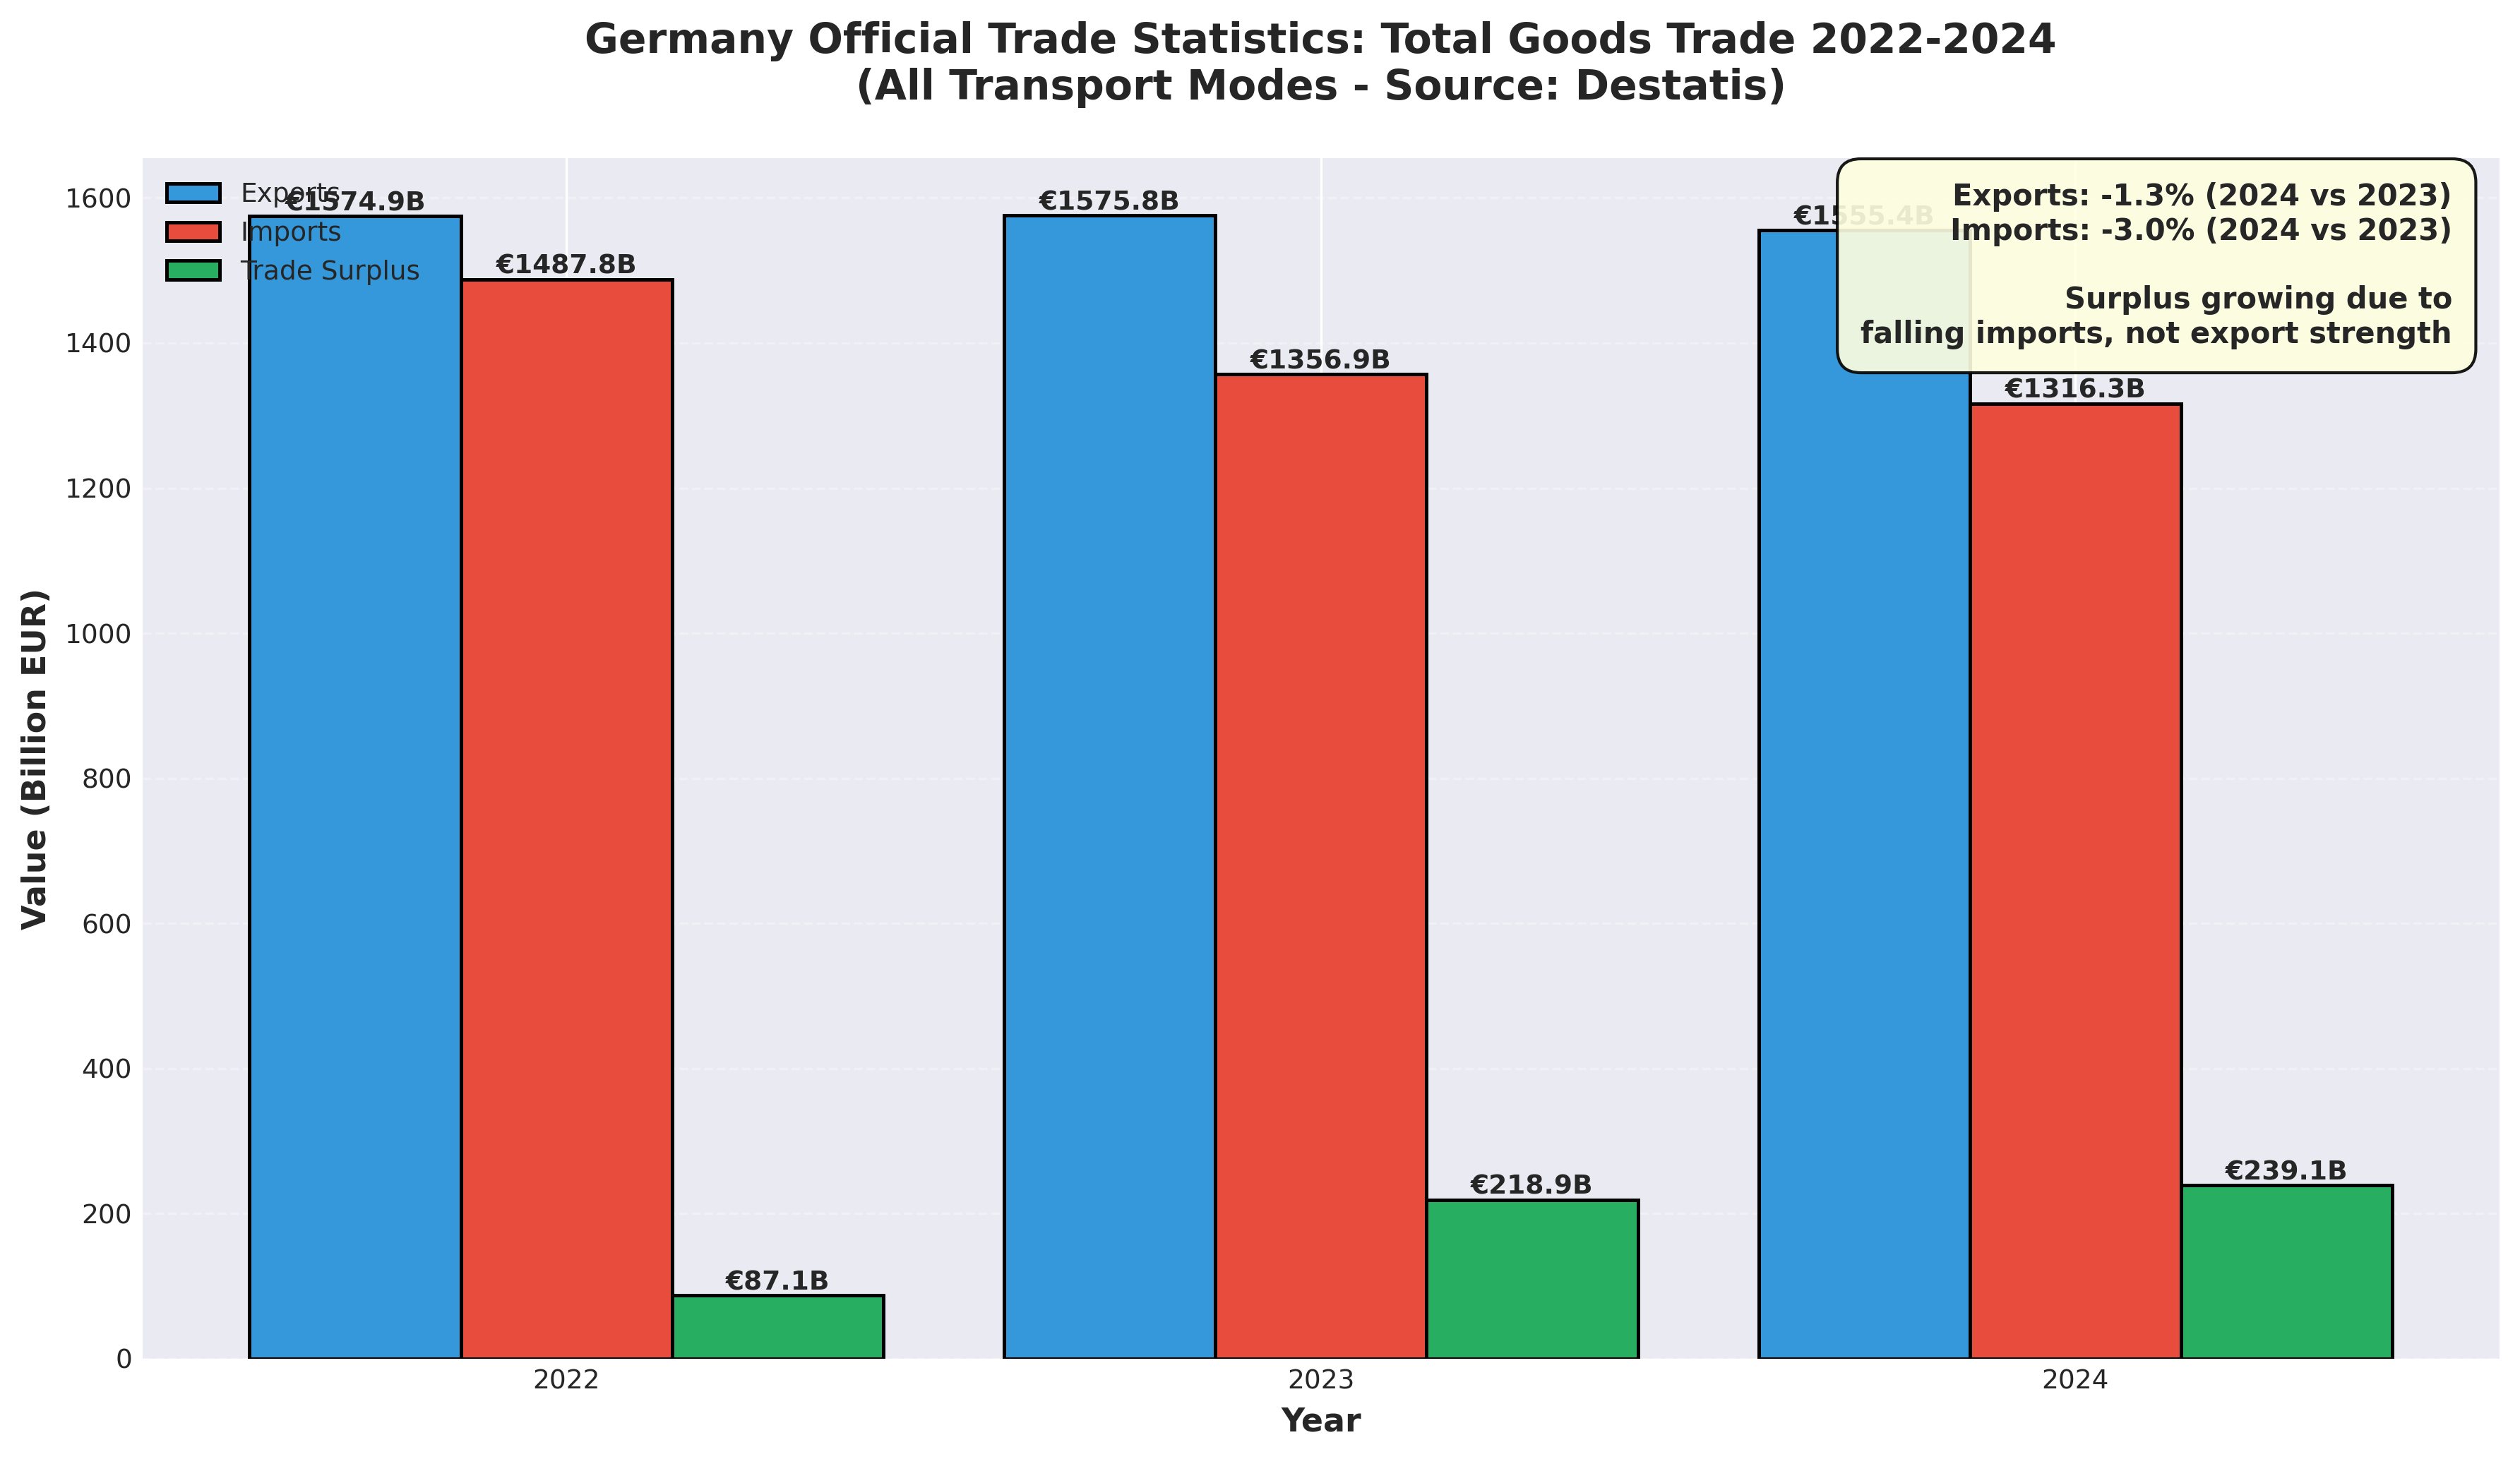
The larger trade surplus resulted not from export strength but from imports falling faster than exports—a pattern typically associated with domestic demand weakness rather than export competitiveness. Germany's imports declined 3.0% while exports fell only 1.3%, suggesting constrained domestic consumption and investment alongside export challenges.
Ocean Container Booking Data: A Complementary Perspective
VIZION API's ocean container booking data—representing a subset of Germany's total containerized trade—provides additional insight into quarterly dynamics and sectoral trends. This data captures real-time container movements, offering leading indicators for trade patterns.
Important Methodological Note: VIZION's data measures container volumes (TEUs) from ocean bookings, not trade values or overall trade balance. A TEU of high-value machinery exports may be worth 10-50 times more than a TEU of furniture imports, yet both count equally in volume metrics. Germany's official trade statistics show a substantial trade surplus (€239.1 billion in 2024) based on monetary value, while VIZION's container data shows higher import volumes than export volumes. These perspectives are complementary rather than contradictory:
- Official statistics measure trade value across all modes (air, sea, rail, road)
- VIZION data measures ocean container booking volumes (TEUs) - a subset of containerized goods
- Container volume patterns reveal logistics trends, supply chain shifts, and category-level dynamics that value data alone doesn't capture
Container volume analysis is particularly valuable for understanding port operations, logistics planning, and product category trends, even when it doesn't mirror overall trade value balance.
Container Import Volumes (VIZION Data):
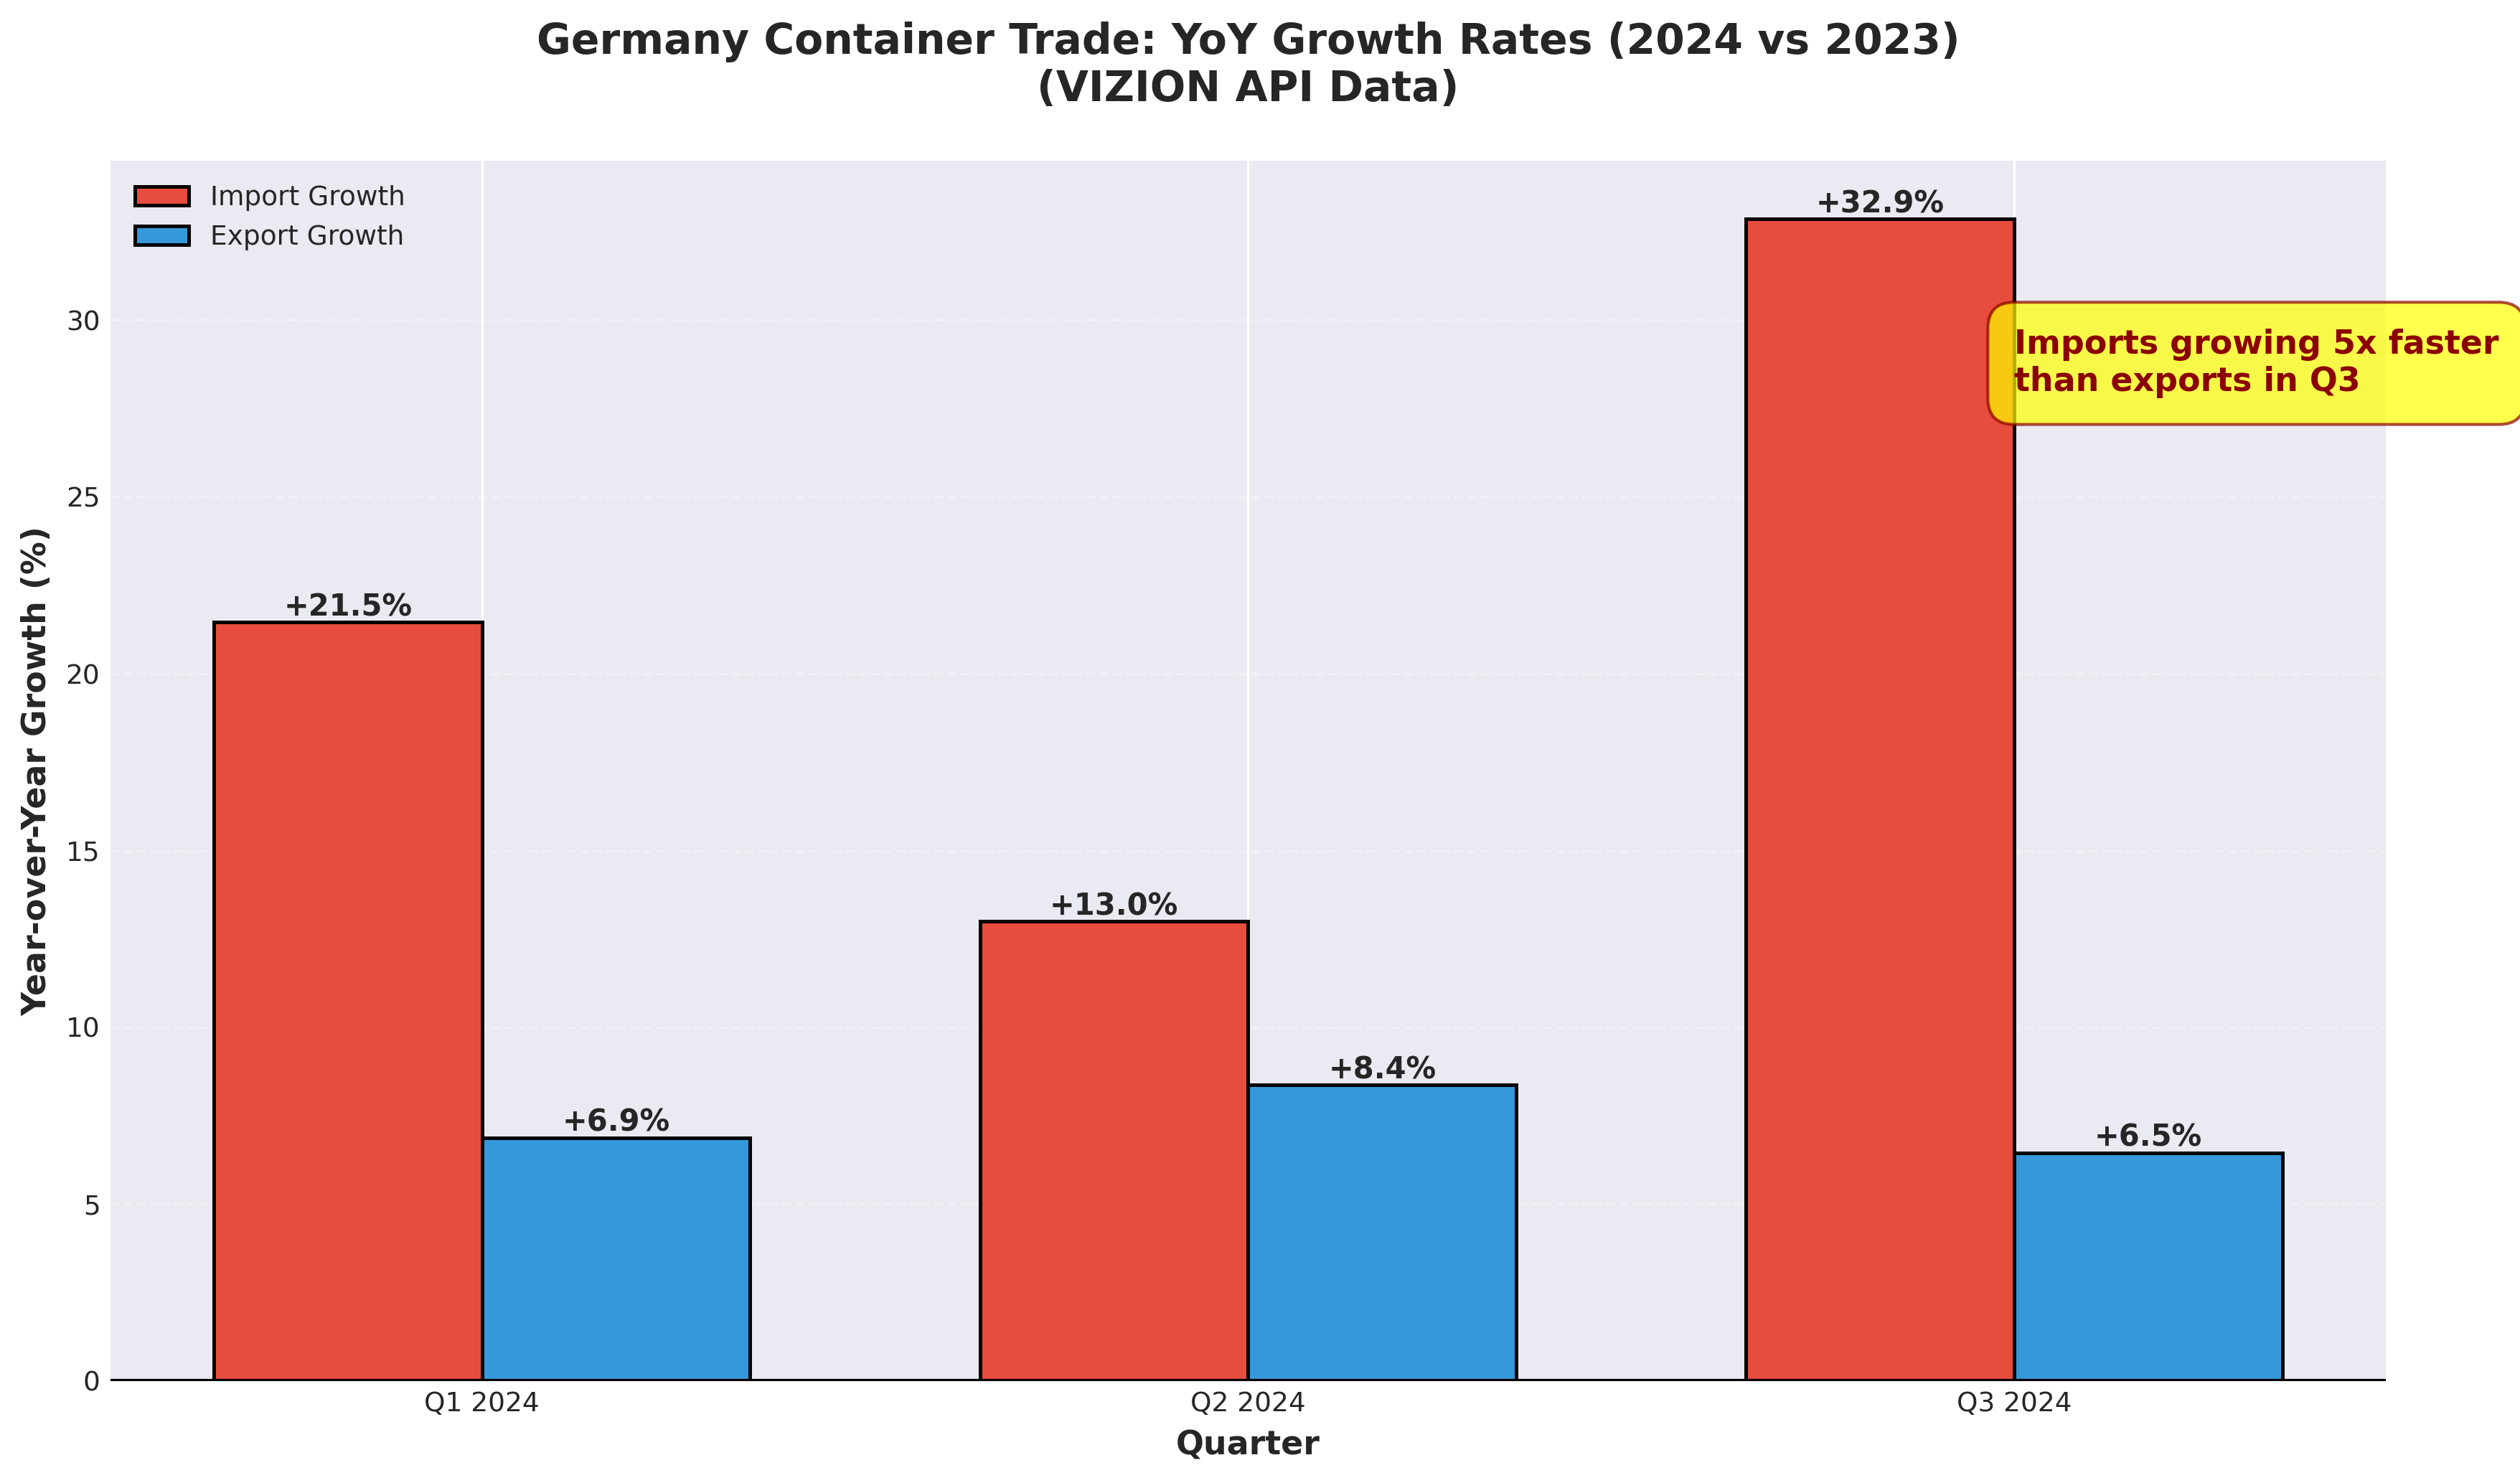
- Q1 2024: 416,743 TEUs (+21.5% YoY)
- Q2 2024: 418,919 TEUs (+13.0% YoY)
- Q3 2024: 486,460 TEUs (+32.9% YoY)
- Q4 2024: 414,768 TEUs (preliminary)
Container Export Volumes (VIZION Data):
- Q1 2024: 387,206 TEUs (+6.9% YoY)
- Q2 2024: 412,310 TEUs (+8.4% YoY)
- Q3 2024: 404,989 TEUs (+6.5% YoY)
- Q4 2024: 383,884 TEUs (preliminary)
*Figure 2: Eight years of quarterly container volume data reveal shifts in Germany's containerized trade patterns. The Q3 2024 import volume surge (+32.9% YoY) coinciding with modest export volume growth indicates changing product mix and supply chain structures. Note: Container volumes (TEUs) differ from trade values. Source: VIZION API
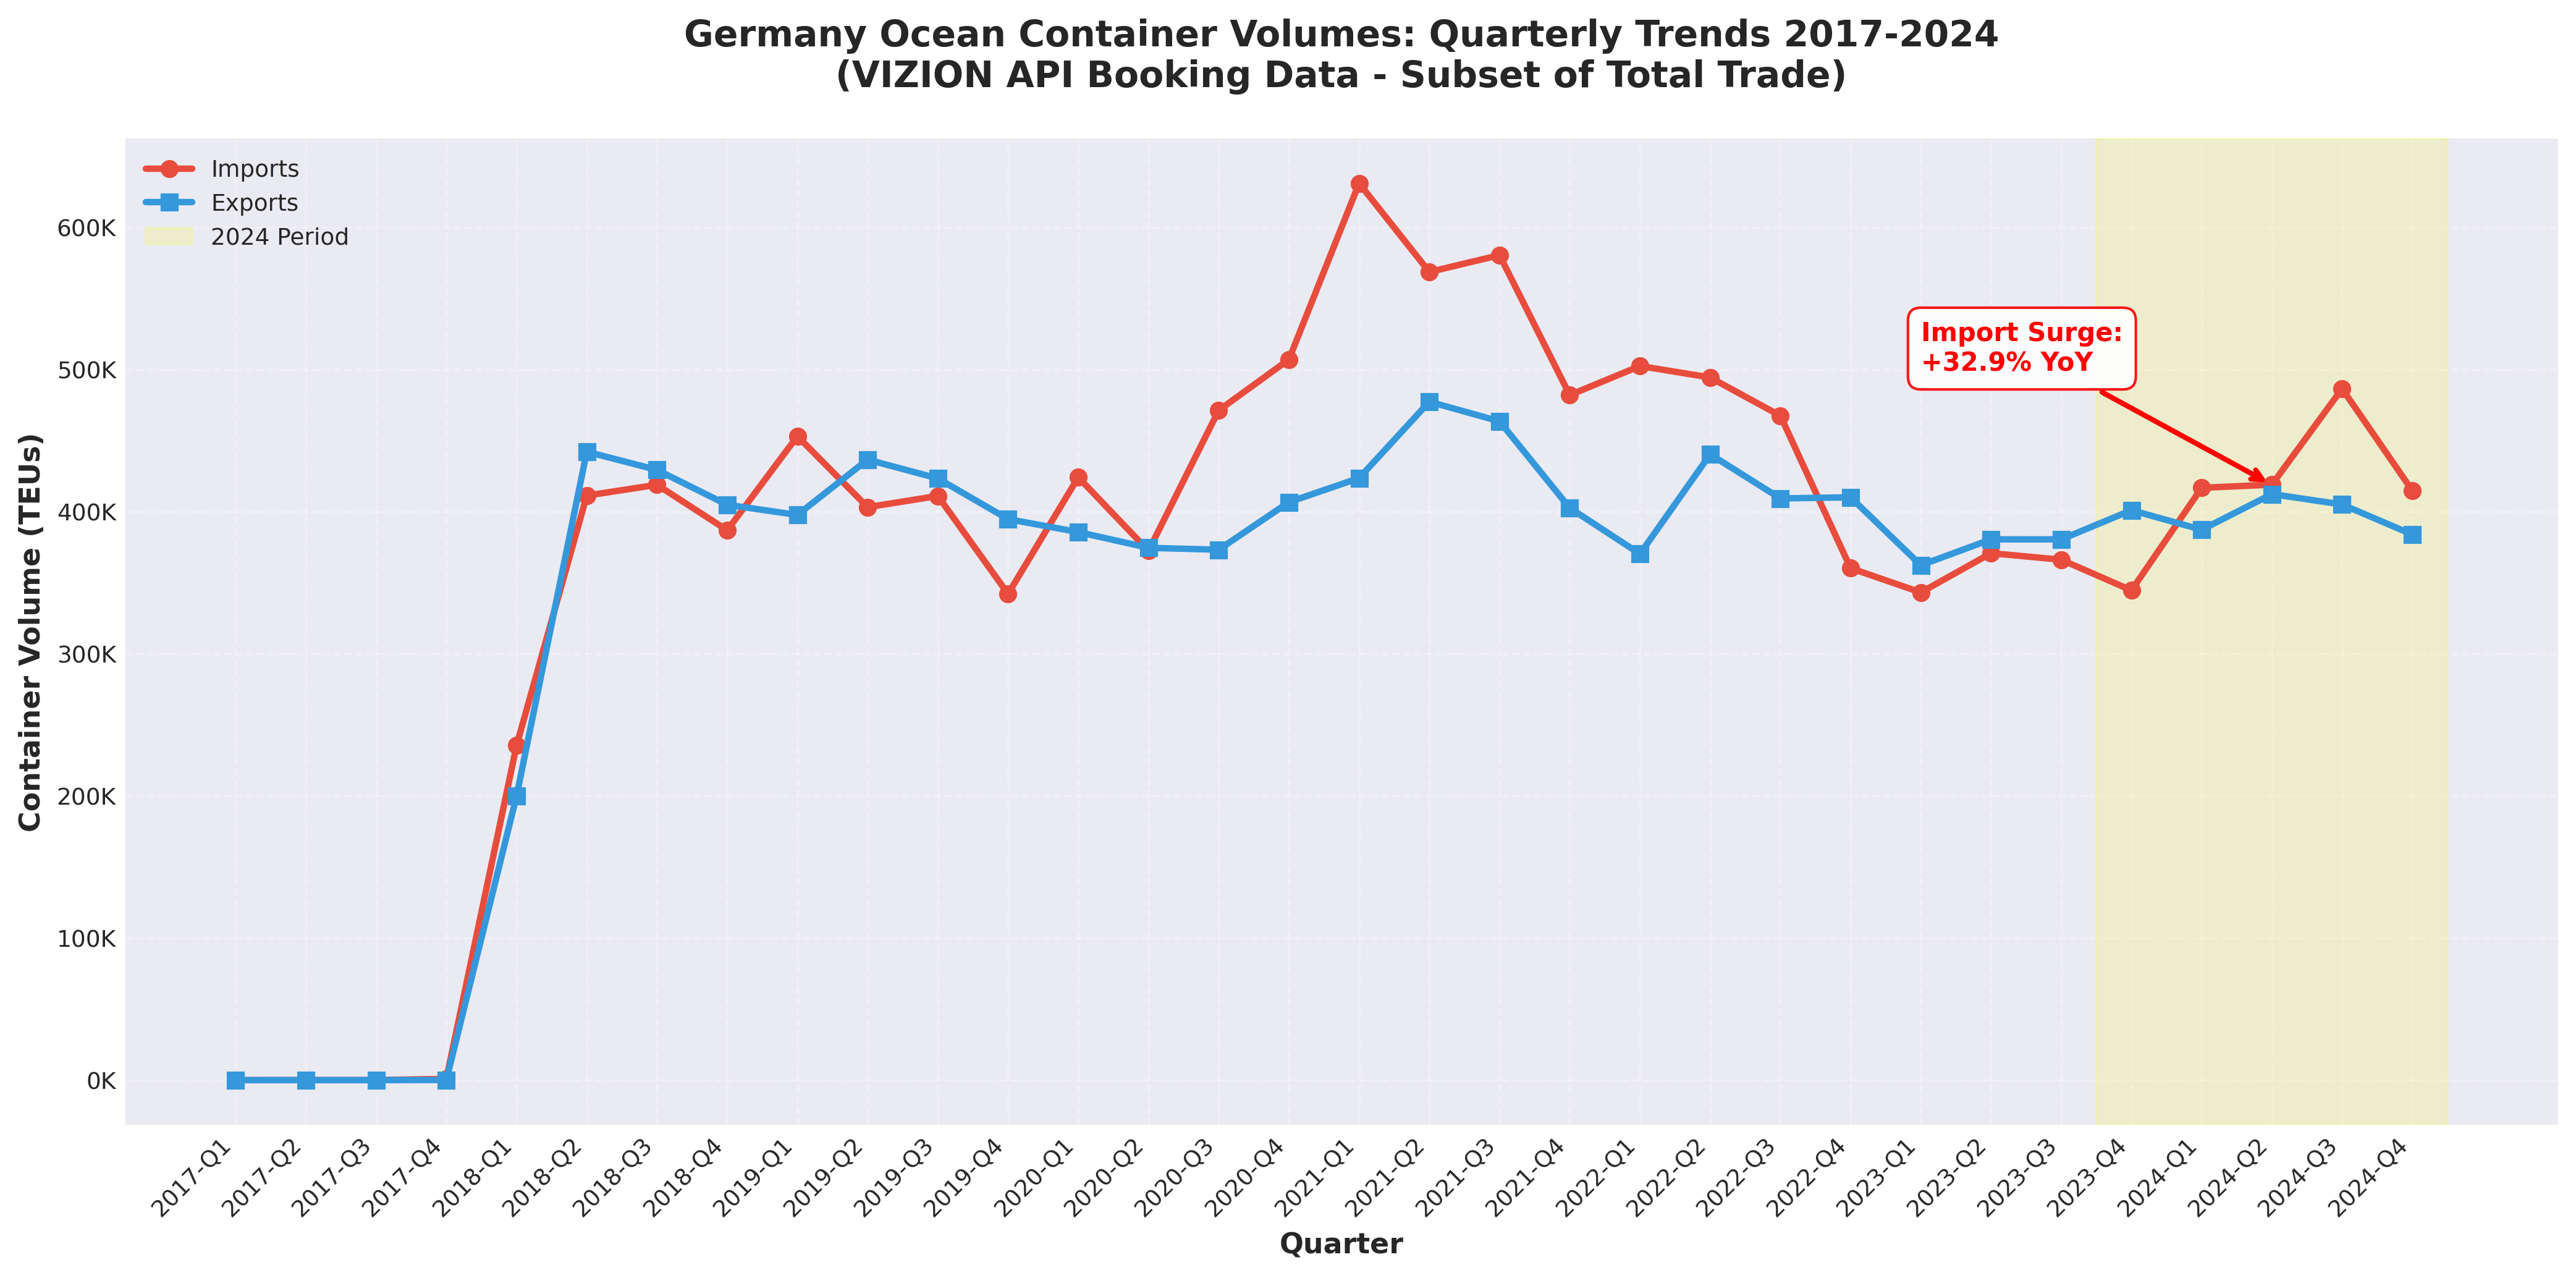
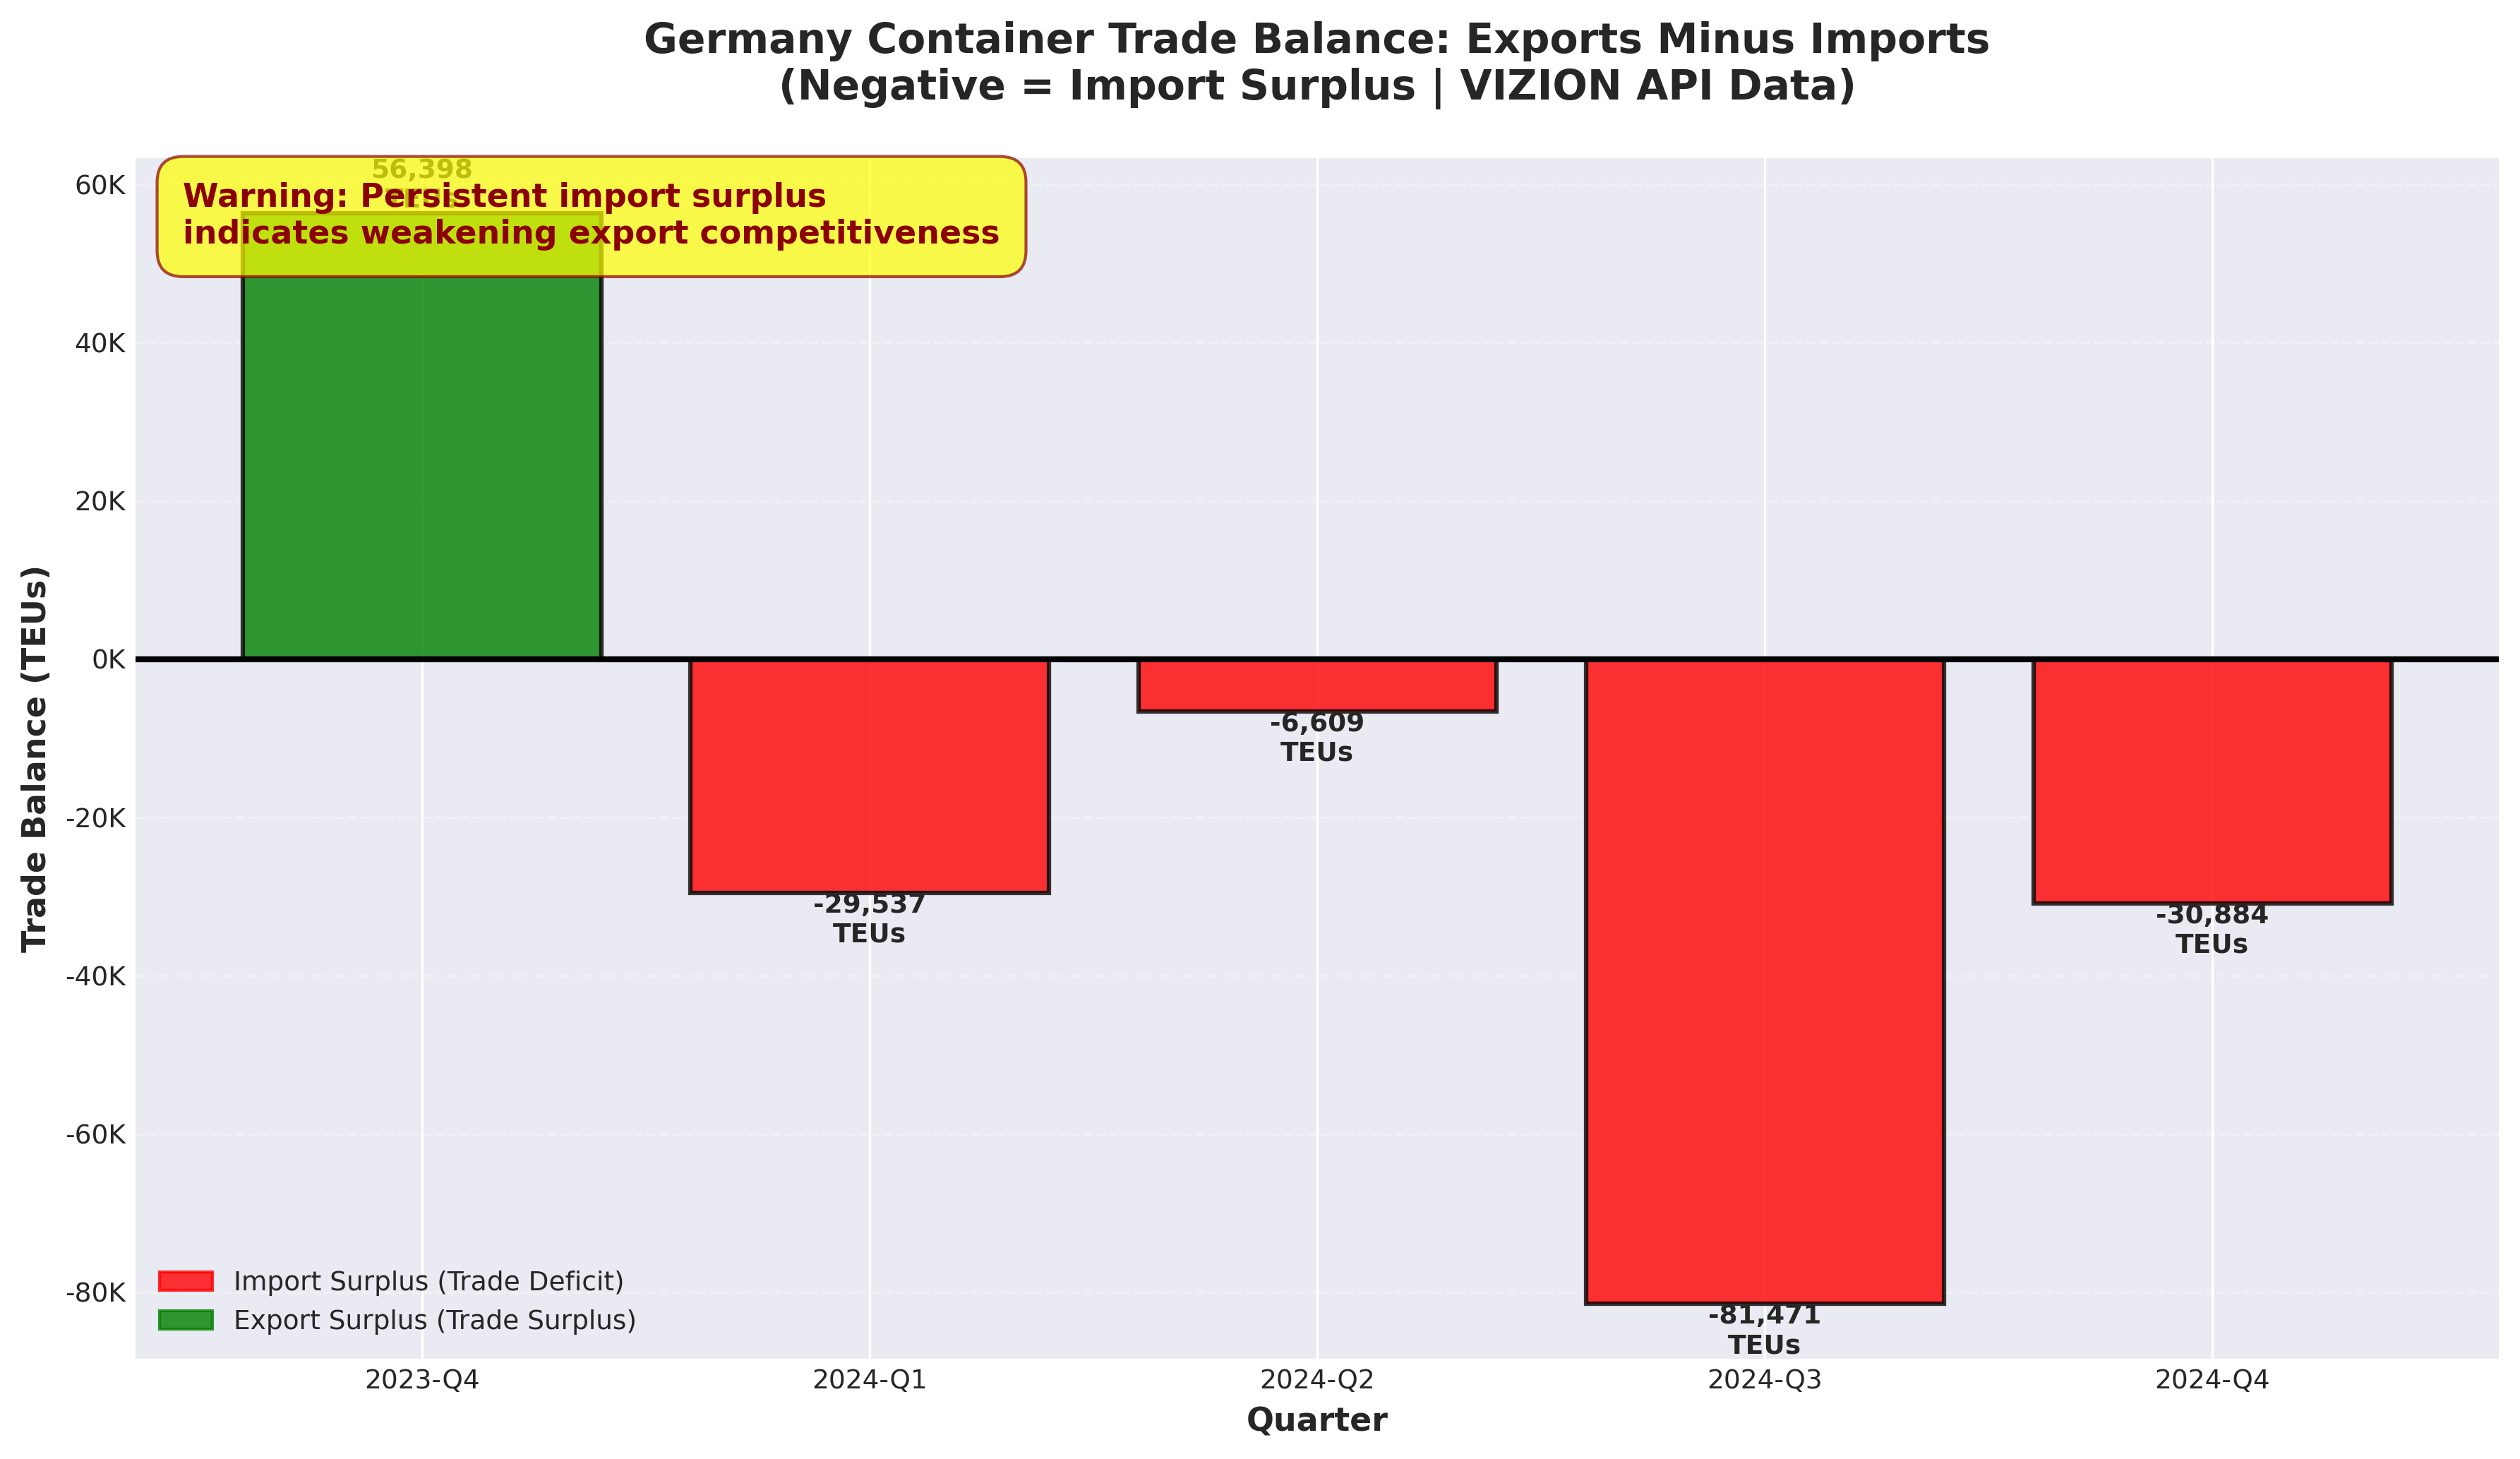
The ocean booking data reveals a notable divergence in container volumes: import bookings surged dramatically in 2024, particularly in Q3 with a 32.9% year-over-year increase, while export volumes showed modest growth at 6.5%. This created a container volume imbalance of 81,471 TEUs (more import TEUs than export TEUs) in Q3 2024 alone—the widest volume gap of the year.
What This Means: While Germany maintains a substantial trade surplus in monetary terms (exports exceed imports in value), the container volume data suggests Germany is shipping more lower-value-per-container imports while exporting fewer but potentially higher-value-per-container goods. This pattern indicates shifts in product mix, supply chain structures, and logistics flows that complement the official value-based trade statistics.
*Figure 3: The divergence between import and export container volume growth rates accelerated through 2024. By Q3, import volumes were growing five times faster than export volumes—indicating significant shifts in containerized trade patterns and product mix. Source: VIZION API*
For an economy built on export strength, increasing import container volumes alongside modest export volume growth suggests German manufacturers and consumers are increasingly sourcing containerized goods from abroad. However, Germany's substantial trade surplus indicates that high-value exports (potentially including non-containerized goods, air freight, and high-value-density containers) continue to exceed import values significantly. The container volume patterns reveal logistics and supply chain dynamics that are strategically important even when they don't reflect overall trade balance.
*Figure 4: Germany's container volume balance (export TEUs minus import TEUs) turned persistently negative throughout 2024, with Q3 showing an 81,000 TEU import volume surplus. Note: This measures container volumes, not trade value. Germany maintains a substantial trade surplus in monetary terms. Source: VIZION API
The Automotive Mega-Crisis: Germany's Industrial Foundation Cracks
No sector better illustrates Germany's trade challenges than automotive manufacturing, the cornerstone of German industrial prowess and export strength. The industry that defined German engineering excellence faces existential pressures from multiple directions.
German automotive production has entered a sustained downward trajectory:
- 2017: 5.6 million units
- 2022: 3.8 million units
- 2024: 4.1 million units
- 2025: Expected further decline
This represents approximately 27% decline from peak production levels, with no recovery in sight. The contraction accelerated in 2025, with auto and auto part exports to the United States—historically Germany's largest export market—declining 8.6% in the first half of the year.
The employment impact has been severe. Over 50,000 jobs in the automotive sector have been eliminated in the past year alone, bringing employment to 721,400—its lowest level since 2013. Major manufacturers including Volkswagen, BMW, and Mercedes-Benz have announced facility closures, production cuts, and workforce reductions extending into 2026.
The China Challenge: From Market to Competitor
German automakers built their China strategy on a simple premise: produce vehicles in Germany, export to China's growing middle class, and reinvest profits into next-generation technology. This model has collapsed with remarkable speed. Germany-China Auto Trade Dynamics:
- German car exports to China: Down double digits in 2024
- Chinese EV market share: Chinese brands now dominate 60%+ of domestic market
- German brands' China sales: BMW down 13%, Mercedes down 13%, VW down 12% in 2024
The rise of Chinese EV manufacturers—BYD, NIO, XPeng, Li Auto—happened faster than German executives anticipated. Chinese brands combined competitive pricing, advanced battery technology, superior digital interfaces, and aggressive innovation cycles to displace established German brands in their largest foreign market.
Meanwhile, Chinese manufacturers are now exporting vehicles to Europe, completing the competitive reversal. BYD's international expansion accelerated dramatically, with exports growing 334% to 242,765 units in 2023, and continued aggressive growth in 2024 targeting Europe as a primary market. German automakers face Chinese competition not only in China but in their home market.
The EV Transition Dilemma
Germany's automotive challenges extend beyond Chinese competition to fundamental technology transitions. While Tesla established EV production in Berlin and Chinese manufacturers invest in European facilities, traditional German automakers struggle with the transition from internal combustion to electric powertrains.
The economic implications are profound: EVs require 30% fewer components than conventional vehicles, eliminating entire supply chain tiers. Battery production—the most valuable component—remains dominated by Asian manufacturers. Software competencies lag behind Tesla and Chinese competitors.
This transformation impacts multiple trade categories within the automotive supply chain:
- HS 8708 (Parts and Accessories for Motor Vehicles): This broad category includes brakes, gearboxes, steering systems, bumpers, and body parts—components that face reduced demand as EVs simplify mechanical systems.
- HS 870829 (Parts and Accessories of Vehicle Bodies): Specifically body components that remain relevant in EV transition.
- HS 870899 (Other Motor Vehicle Parts): Miscellaneous automotive components, some of which maintain export strength in specialized applications.
German automakers' attempt to compete by building their own software platforms has yielded disappointing results. VW's Cariad software division faced years of delays and quality issues before recent restructuring. The gap between German automakers and software-native competitors like Tesla continues widening rather than narrowing.
China Trade: The Partner-Competitor Paradox
Germany's overall trade relationship with China has evolved into what analysts describe as a "partner-competitor paradox"—China remains Germany's largest trading partner while simultaneously becoming its most formidable industrial competitor.
Germany-China Trade (Jan-Aug 2025):
- Total bilateral trade: €163.4 billion (China #1 trading partner)
- German exports to China: €54.7 billion (-13.5% YoY)
- German imports from China: €108.7 billion (+8.3% YoY)
- Trade deficit with China: €54.0 billion (widening)
*Note: These figures reflect the initial Jan-Aug 2025 data. Destatis later released corrected data showing €185.9 billion for Jan-Sep 2025, confirming China's position as Germany's top trading partner.*
China overtook the United States as Germany's top trading partner in 2025, but the composition reveals Germany's weakening competitive position. German exports to China—traditionally dominated by premium vehicles, machinery, and industrial equipment—declined sharply while imports from China surged.
The import increase reflects China's rapid ascent in manufactured goods that Germany once dominated: machine tools, electrical equipment, industrial machinery, and renewable energy components. Chinese manufacturers are no longer just producing consumer electronics and textiles; they now compete directly with German industrial exports.
Manufacturing Competition: From Customers to Competitors
The transformation of Chinese companies from customers purchasing German machinery to competitors producing advanced manufacturing equipment represents a seismic shift in global industrial dynamics. Machinery and Equipment Exports:
- German machinery exports to China: -2.1% in Q1 2024
- Chinese machinery production: Growing at 8% annually
- German machinery exporters' China orders: Down across multiple quarters
German machinery manufacturers historically supplied Chinese factories with advanced equipment for automotive, electronics, and industrial production. Chinese companies learned, adapted, and increasingly produce competitive alternatives domestically. The "Made in China 2025" initiative successfully moved Chinese manufacturing up the value chain into sectors Germany once dominated.
This shift appears in VIZION's ocean container booking data, where export container volumes to China show persistent weakness while import container volumes from China surge. German companies are now importing containerized Chinese-made products across critical categories:
- HS 84 (Nuclear Reactors, Boilers, Machinery): Industrial machinery and mechanical appliances that Germany traditionally exported
- HS 85 (Electrical Machinery and Equipment): Electronic components, telecommunications equipment, and electrical apparatus
- HS 87 (Vehicles and Automotive Parts): Not just finished vehicles, but increasingly components and subsystems
These categories were German export strengths a decade ago; today they represent growing import dependencies on Chinese manufacturing.
Category-Level Analysis: Winners and Losers
VIZION API's granular HS code-level data reveals which specific product categories are driving Germany's trade transformation. The Q3 2024 vs Q3 2023 comparison shows dramatic shifts across multiple sectors.
Understanding HS Codes: The Harmonized System (HS) is an internationally standardized system of names and numbers for classifying traded products. Developed by the World Customs Organization, HS codes enable consistent product categorization across borders. Codes like "HS 9403" represent furniture, "HS 87" covers vehicles and automotive parts, and "HS 84" encompasses machinery and mechanical appliances. Throughout this analysis, we provide descriptions alongside codes to make technical trade data accessible to business audiences.
*Figure 5: Category-level analysis reveals furniture imports surging while wood pulp exports collapse—symptomatic of Germany's shift from industrial production to consumption. Source: VIZION API*
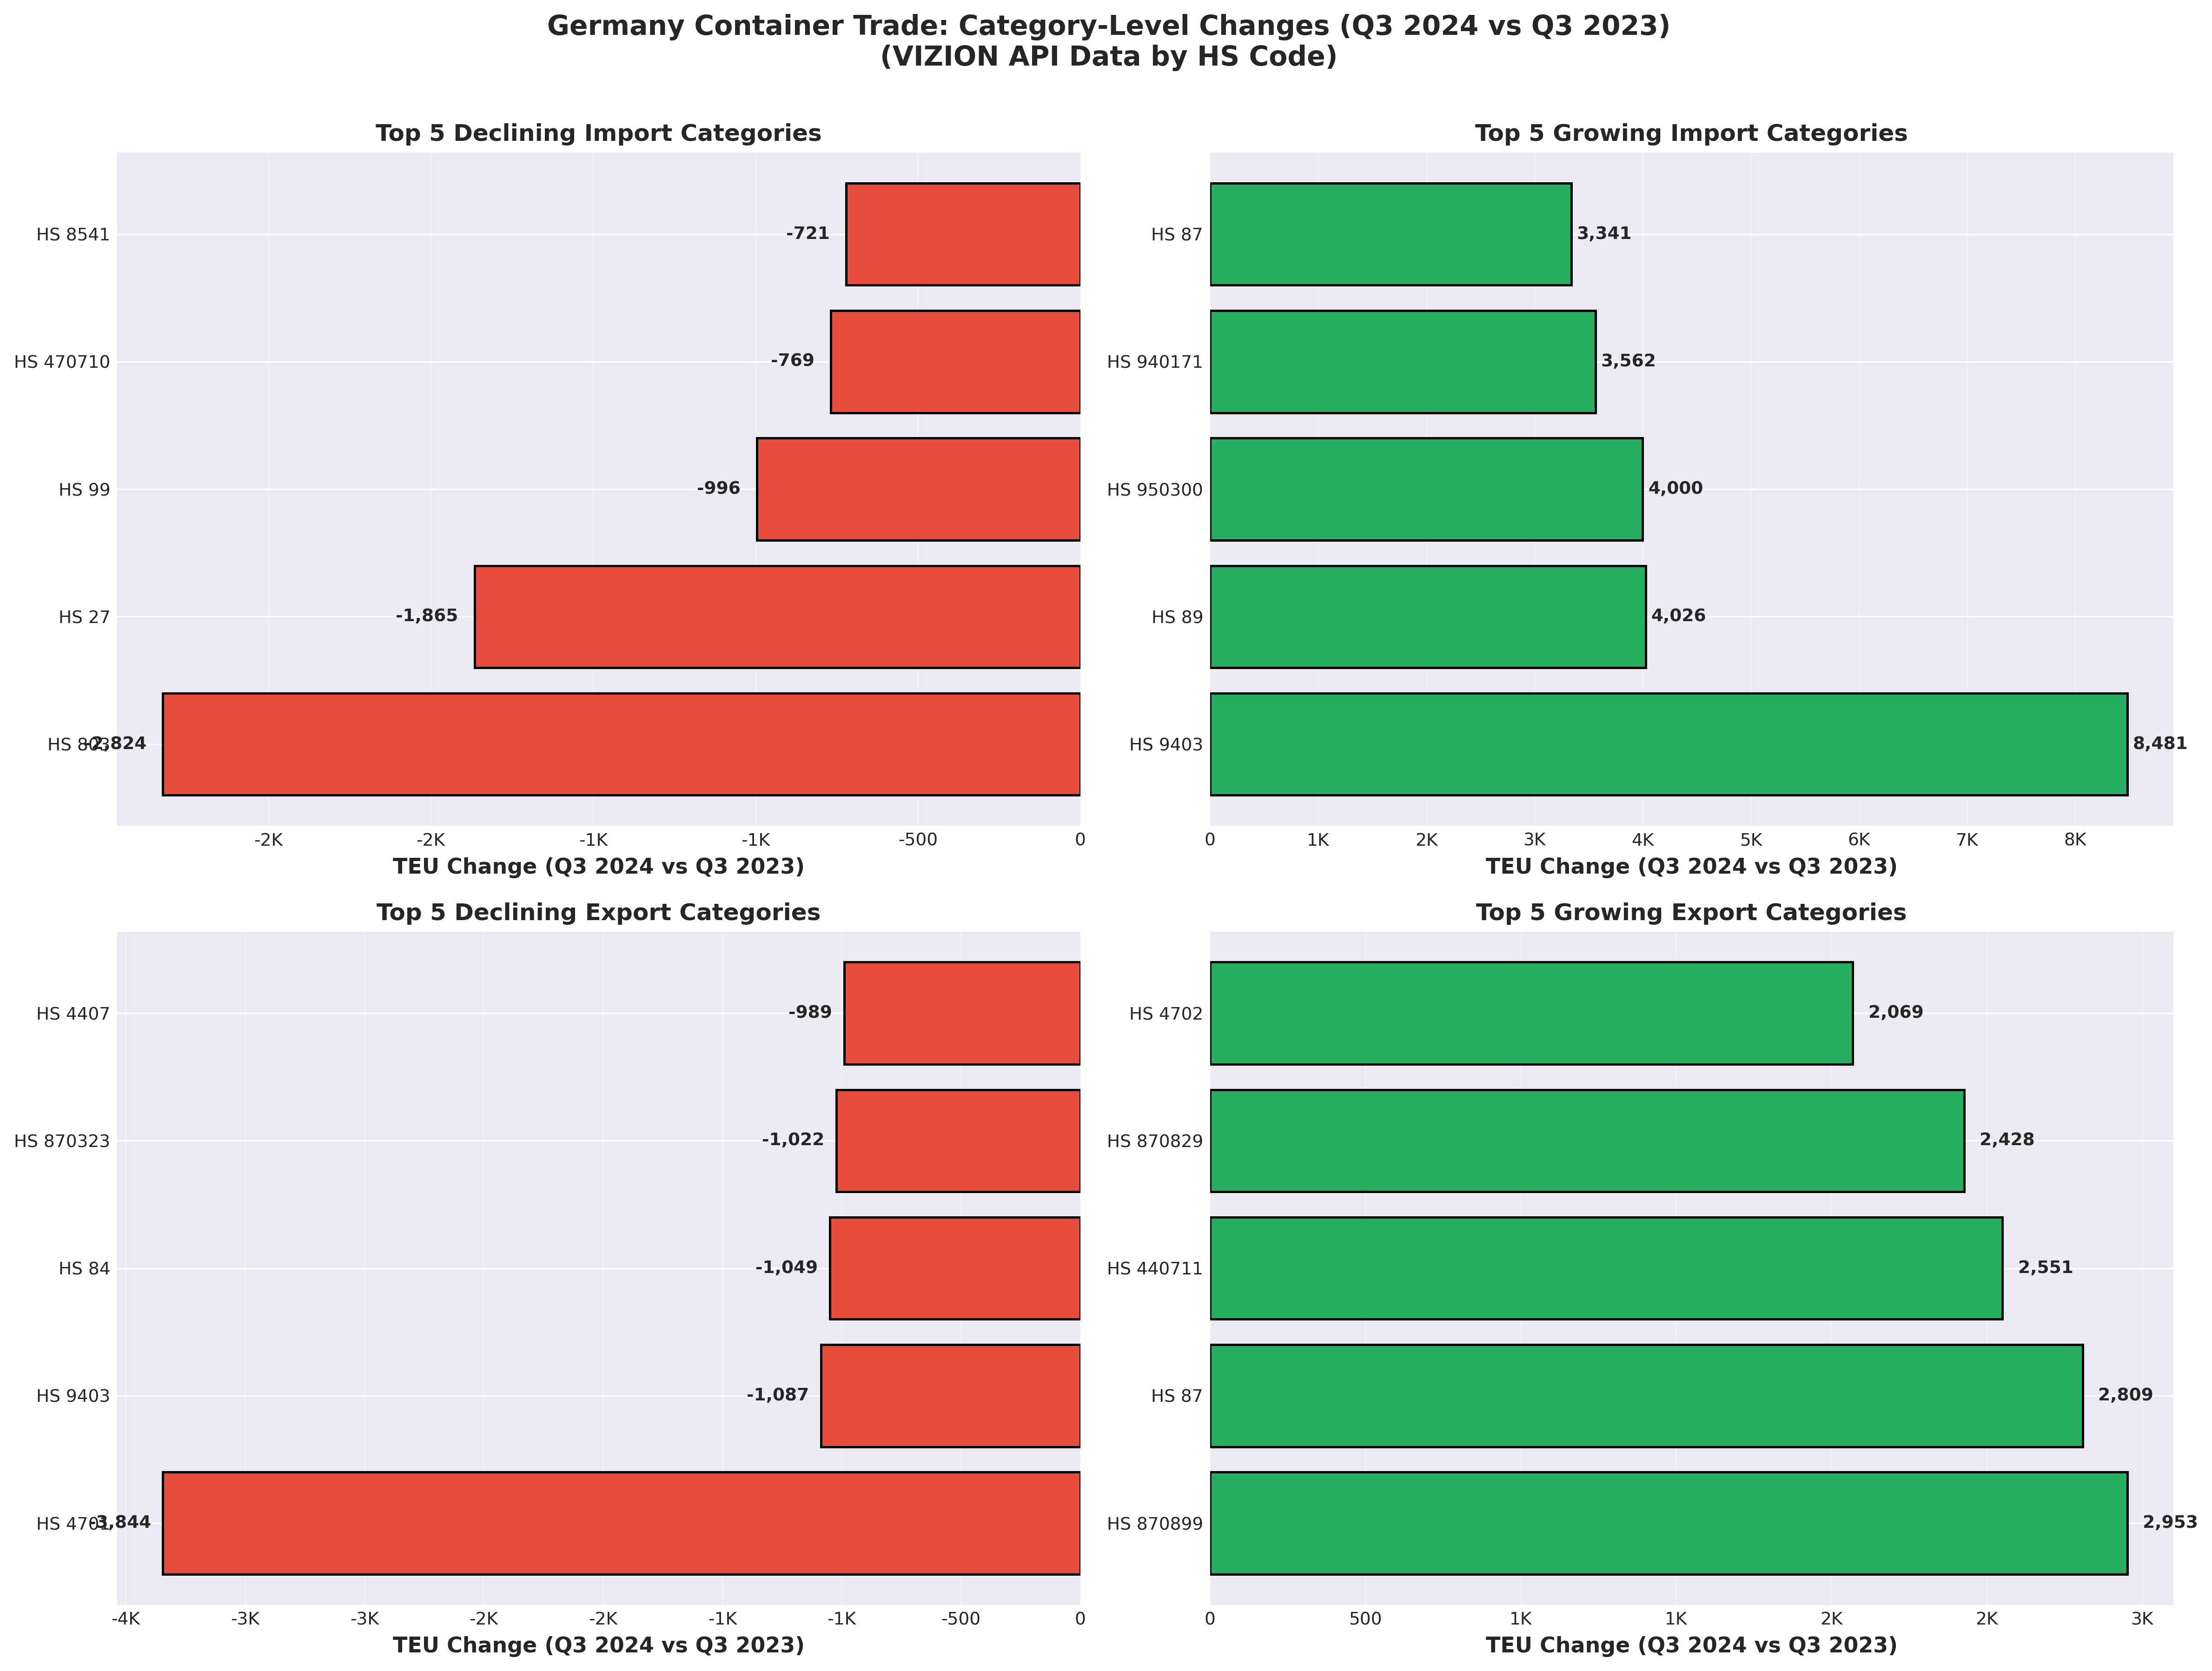
Import Growth Leaders (Q3 2024 vs Q3 2023):
- HS 9403 - Furniture (+8,481 TEUs): This category includes metal, wooden, plastic, and upholstered furniture for offices, bedrooms, kitchens, and other purposes. The massive import increase reflects Germany sourcing finished furniture from Asian manufacturers rather than domestic production.
- HS 89 - Ships, Boats, and Floating Structures (+4,026 TEUs): Includes vessels for transporting goods and persons, fishing vessels, tugs, floating platforms, and related maritime equipment. The surge may indicate port infrastructure investments or maritime fleet renewals.
- HS 950300 - Toys (+4,000 TEUs): Encompasses tricycles, scooters, pedal cars, dolls, doll carriages, puzzles, and other toys. This category's dramatic growth underscores Germany's increased reliance on Asian consumer goods manufacturing.
Import Decline Leaders:
- HS 803 - Metal Ores (-2,824 TEUs): The decline in metal ore imports suggests weakening domestic industrial production and steel manufacturing activity.
- HS 27 - Fuel Products (-1,865 TEUs): Reduced fuel imports may reflect Germany's ongoing energy transition and temporarily lower industrial demand.
Export Decline Leaders (Q3 2024 vs Q3 2023):
- HS 4701 - Mechanical Wood Pulp (-3,844 TEUs): This category represents mechanically processed wood fibers used as raw material for paper and paperboard production. The collapse in wood pulp exports signals weakness in Germany's forest products and paper supply chain exports.
- HS 9403 - Furniture (-1,087 TEUs): Germany experiences the double challenge of declining furniture exports while furniture imports surge—a clear indicator of lost manufacturing competitiveness in this sector.
Export Growth Leaders:
- HS 870899 - Other Parts and Accessories of Motor Vehicles (+2,953 TEUs): This detailed subcategory within automotive parts (Chapter 87) includes various vehicle components and accessories. Despite overall automotive weakness, certain specialized parts maintain export strength.
- HS 440711 - Wood Products (+2,551 TEUs): This category within Chapter 44 (Wood and Articles of Wood) shows some segments of the timber industry maintaining export competitiveness.
The Strategic Pattern
The category-level container volume data reveals noteworthy shifts: surging import volumes of finished consumer goods (furniture, toys, ships) while traditional industrial and intermediate goods export volumes (wood pulp, industrial materials) decline substantially.
This container volume pattern, combined with Germany's overall trade surplus, suggests Germany is shifting toward exporting higher-value-per-container goods while importing larger volumes of lower-value-per-container consumer products. Even within automotive exports—traditionally Germany's core strength—the container data shows volume weakness in key subcategories like HS 8708 (Parts and Accessories for Motor Vehicles), which encompasses essential components like bumpers, brakes, gearboxes, steering systems, and body parts.
The simultaneous import surge and export decline in furniture (HS 9403) exemplifies how German manufacturers lose ground to Asian competitors in both domestic and international markets—a pattern that may spread to other manufacturing sectors without strategic intervention.
The Chemical Industry: Structural Challenges Beyond Cyclical Weakness
Germany's chemical industry—home to BASF, Bayer, and dozens of specialty chemical producers—faces its own crisis distinct from but reinforcing automotive challenges. Chemical exports declined throughout 2024, with industry leaders warning the previous model of exporting basic chemicals has ended.
Energy Costs and Competitiveness
The loss of cheap Russian natural gas fundamentally altered German chemical industry economics. Natural gas serves not only as an energy source but as a feedstock for chemical production. German chemical companies paid 3-4 times higher energy costs than U.S. competitors in 2024, directly impacting profitability and production decisions.
BASF, Germany's largest chemical producer, announced closure of nylon precursor production at its Ludwigshafen facility—the company's flagship site—citing uncompetitive energy costs. Similar announcements from other producers signal a broader retreat from energy-intensive basic chemical production in Germany.
German Chemical Industry Performance:
- H1 2024 industrial chemical sales: Down €7 billion vs H1 2023
- Production capacity utilization: Below 80% (well below optimal levels)
- Exports: Down mid-single digits in 2024
- Employment: Steady reductions through attrition and restructuring
The China Factor in Chemicals
Chinese chemical production capacity has grown explosively, creating massive overcapacity that Chinese producers export globally at aggressive prices. China now produces approximately 45% of global chemical output compared to significantly smaller shares for Western producers, with costs 30-50% lower in many categories.
German chemical exports increasingly focus on specialty chemicals and pharmaceuticals requiring advanced technical capabilities, retreating from commodity chemicals where Chinese competitors dominate on cost. This represents a strategic repositioning but means smaller revenue bases and reduced economies of scale.
The chemical industry's challenges compound automotive sector problems—chemicals supply materials to automotive, machinery, construction, and consumer goods manufacturing. Weakness in multiple sectors creates a negative multiplier effect throughout German industry.
Port and Logistics Implications: Hamburg and Bremerhaven
Germany's trade challenges manifest directly in port operations and logistics networks. Hamburg and Bremerhaven, Germany's two largest container ports, provide physical evidence of changing trade patterns.
Hamburg: Modest Growth Masks Deeper Issues
The Port of Hamburg handled 7.8 million TEUs in 2024, a modest 0.9% increase over 2023's 7.7 million TEUs. While port authorities highlight growth resumption after previous declines, the absolute volume remains significantly below 2022's 8.3 million TEUs.
Hamburg Container Throughput:
- 2022: 8.3 million TEUs
- 2023: 7.7 million TEUs (-7.2%)
- 2024: 7.8 million TEUs (+0.9%)
- H1 2025: 4.2 million TEUs (+9.3% vs H1 2024)
The first-half 2025 improvement (+9.3%) resulted partly from increased liner services calling Hamburg, indicating carriers' route adjustments rather than fundamental demand growth. Container volumes remain well below pre-pandemic trajectories, suggesting Germany's import-export balance has shifted structurally rather than cyclically.
Hamburg's traditional role as Europe's gateway for Chinese imports and German exports faces pressure from changing trade patterns. As German exports to China decline and Chinese imports increase, cargo flows become more imbalanced, affecting vessel utilization and port efficiency.
Bremerhaven: Specialized Challenges
Bremerhaven, specializing in automotive and containerized cargo, faces particular pressure from automotive sector weakness. The port handled 4.4 million TEUs in 2024, a 6.3% increase, but automotive exports—a core competency—face sustained headwinds from industry restructuring.
Bremerhaven Performance:
- Container throughput 2024: 4.4 million TEUs (+6.3%)
- Automotive terminal: Under pressure from production cuts
- Total cargo: 61.9 million tons (+5.9%)
The port's automotive terminals, designed for processing German vehicle exports globally, operate below optimal capacity as production cuts reduce vehicle volumes. Bremerhaven exemplifies how manufacturing sector challenges directly impact logistics infrastructure designed for Germany's export-oriented economy.
What's Driving the Decline: Energy, Competition, and Structural Change
Germany's trade challenges stem from a convergence of factors creating what economists describe as a structural rather than cyclical adjustment:
1. Energy Costs and Industrial Competitiveness
The end of cheap Russian natural gas fundamentally altered German industrial cost structures. Germany paid among the highest industrial electricity prices in Europe throughout 2024, directly impacting energy-intensive industries including chemicals, metals, and machinery.
German Industrial Energy Costs (2024):
- Industrial electricity: 3-4x higher than U.S. costs
- Natural gas: 2-3x higher than pre-2022 levels
- Energy-intensive industries: Operating at 75-80% capacity utilization
High energy costs create a permanent competitive disadvantage in commodity and energy-intensive manufacturing, forcing German industry to retreat from segments where energy represents a significant cost component. This accelerates the shift toward higher-value specialty products but reduces overall production volumes and employment.
2. Chinese Manufacturing Ascent
China's manufacturing capabilities have evolved from low-cost production of labor-intensive goods to advanced manufacturing across automotive, machinery, chemicals, and electronics. Chinese manufacturers now compete with German companies on technology, quality, and innovation—not just price.
The speed of China's manufacturing advancement caught European policymakers and business leaders unprepared. Within a decade, Chinese companies moved from importing German machinery to producing competitive alternatives and exporting them globally. This pattern repeated across industry after industry.
3. Demographic Headwinds and Labor Challenges
Germany's aging workforce creates labor shortages in skilled manufacturing occupations even as overall employment remains high. The country needs an estimated 400,000 skilled workers annually to maintain current production levels, but demographic decline makes this mathematically impossible without massive immigration.
Labor shortages particularly impact manufacturing requiring specialized skills—precision machining, industrial maintenance, quality engineering—where decades of experience matter. German companies cannot easily relocate these capabilities or replace experienced workers with automation.
4. Housing Market Freeze and Domestic Demand
Like the United States, Germany's housing market has largely frozen due to high interest rates, directly impacting construction materials, furniture, appliances, and related imports and exports. German exports of building materials and construction equipment declined throughout 2024 as European construction activity slowed.
Domestic German construction activity similarly stagnated, affecting demand for construction materials, steel, chemicals, and equipment—creating negative multiplier effects across multiple industries.
5. Trade Policy Uncertainty
Escalating trade tensions between the U.S., China, and Europe create planning uncertainty that dampens investment and trade volumes. German exporters face U.S. tariff threats, Chinese retaliation against EU automotive tariffs, and broader geopolitical tensions affecting long-term strategic planning.
German companies—particularly in automotive—opposed EU tariffs on Chinese electric vehicles, fearing retaliation would harm their own China operations. This tension between European industrial policy and German business interests creates strategic uncertainty.
Looking Ahead: 2025-2026 Scenarios and Strategic Planning
VIZION API's ocean booking data provides forward visibility into 2025-2026 containerized trade patterns, though forecast data should be interpreted as directional rather than precise predictions. These projections represent container volume trends, not trade value forecasts.
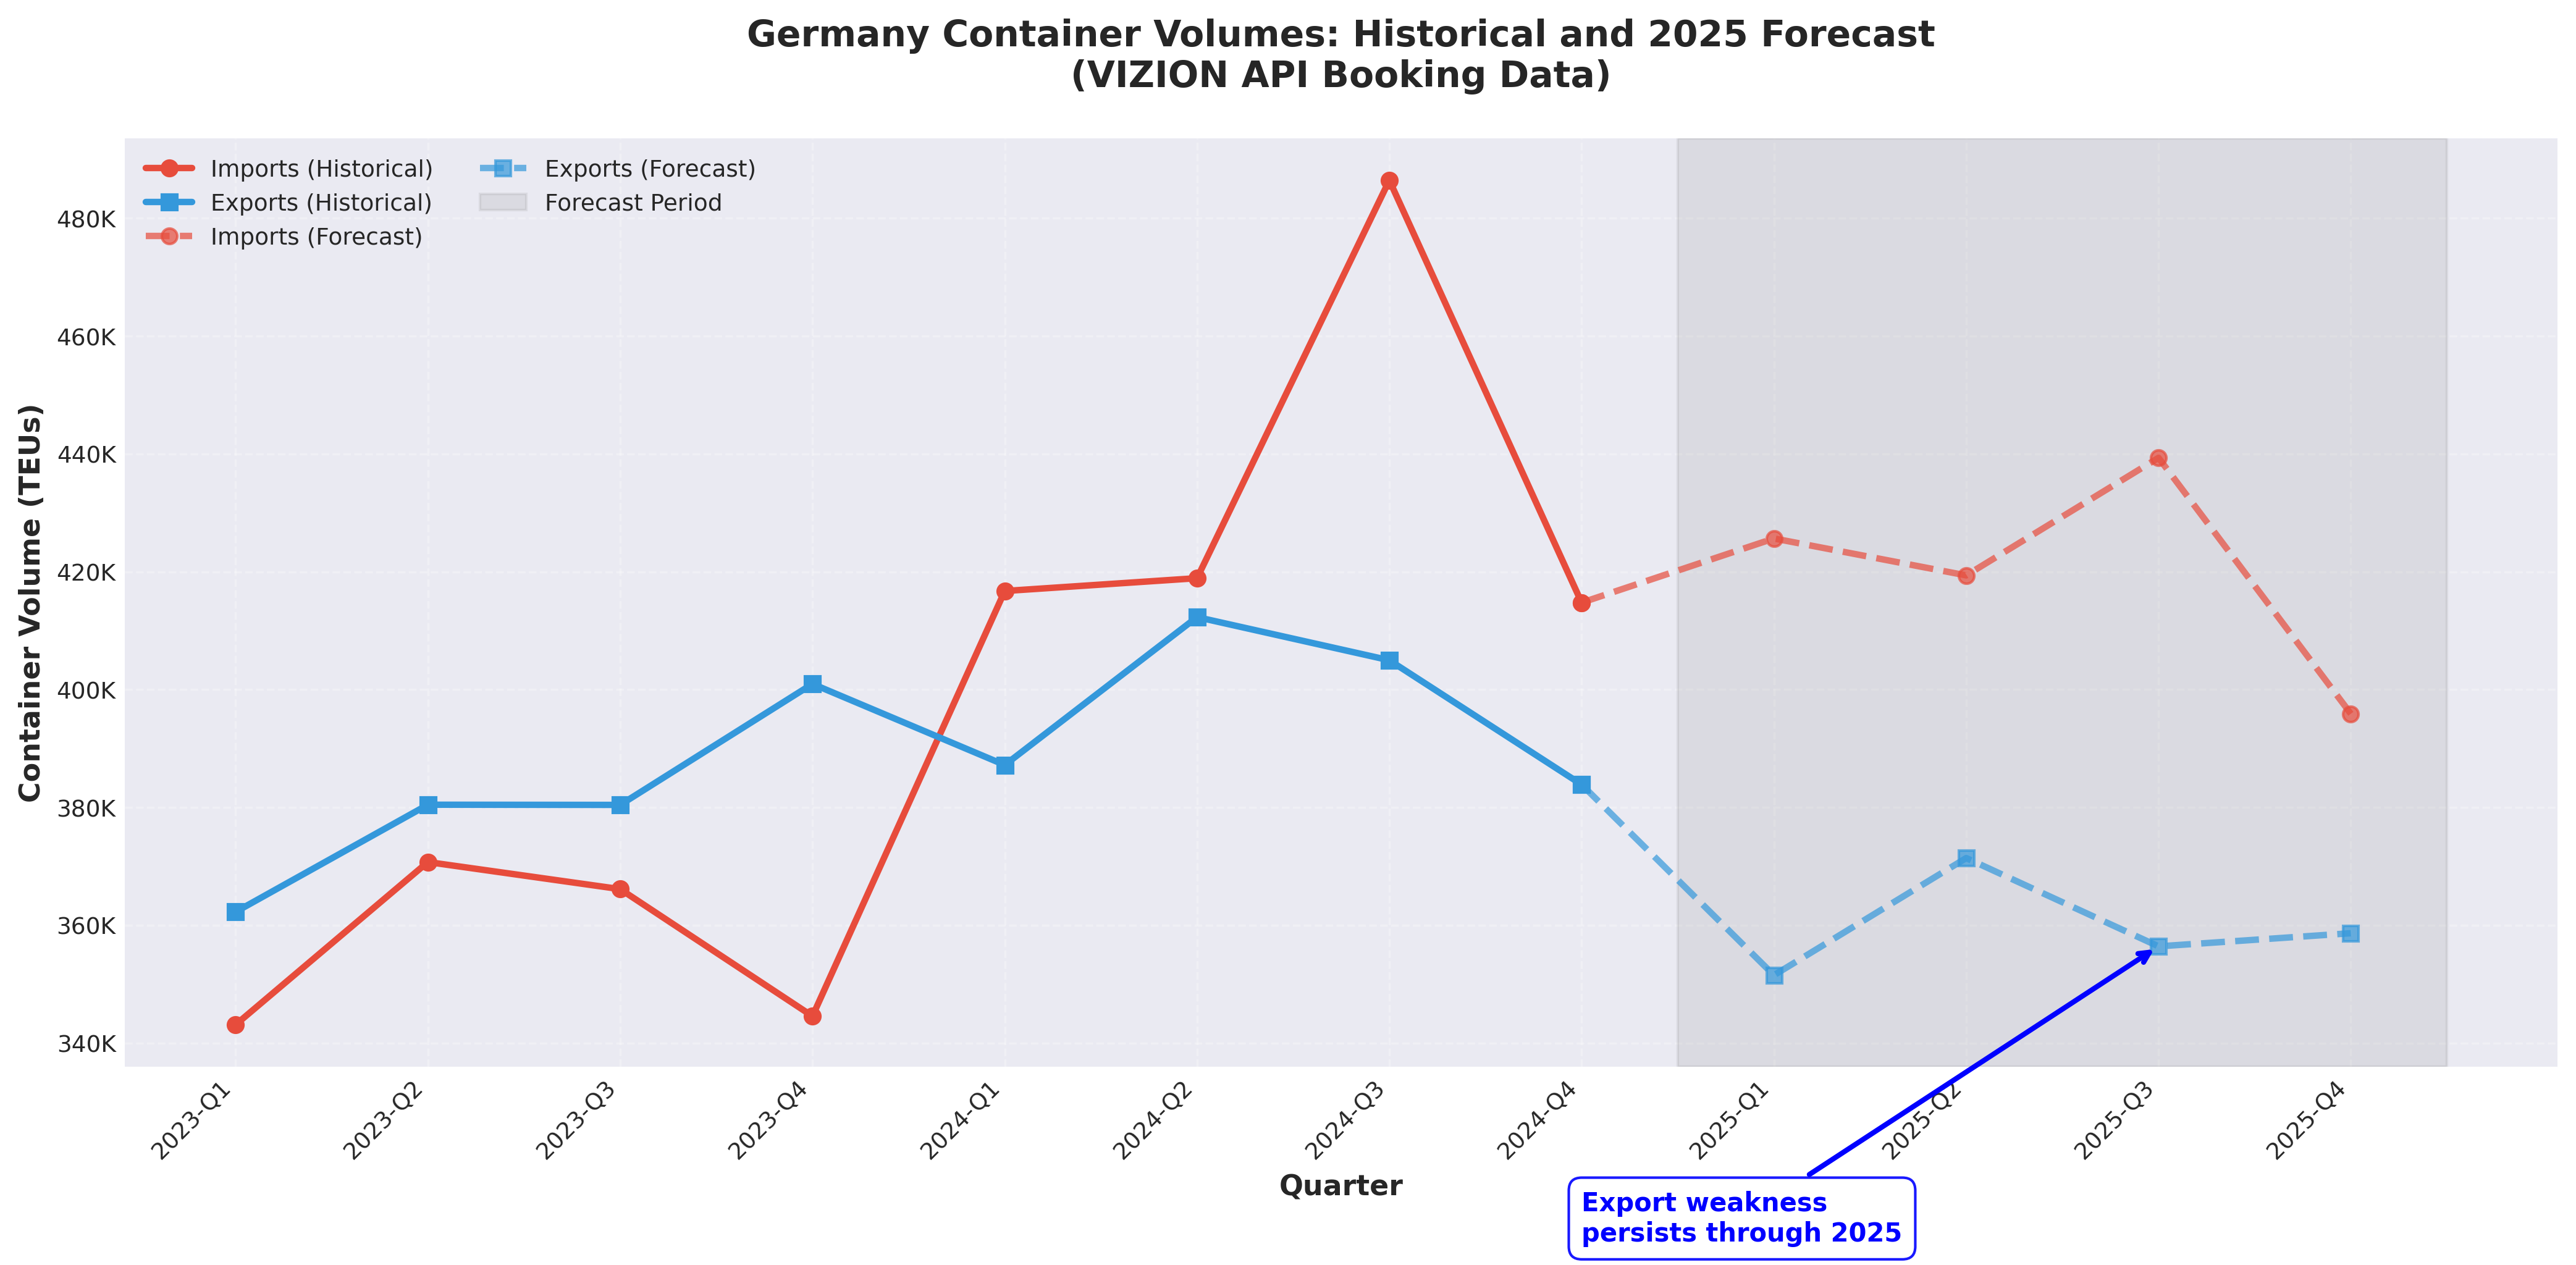
*Figure 6: VIZION forecast data suggests export weakness will persist through 2025, with imports maintaining elevated levels—continuing the pattern that emerged in 2024. Source: VIZION API
Container Volume Forecasts
Projected Import Volumes:
- Q1 2025: 425,660 TEUs
- Q2 2025: 419,392 TEUs
- Q3 2025: 439,354 TEUs
- Q4 2025: 395,902 TEUs
Projected Export Volumes:
- Q1 2025: 351,522 TEUs
- Q2 2025: 371,411 TEUs
- Q3 2025: 356,420 TEUs
- Q4 2025: 358,651 TEUs
The forecast suggests import container volumes will remain significantly higher than export container volumes through 2025, continuing the volume pattern that developed in 2024. Export volumes show modest sequential stability rather than growth, suggesting logistics patterns for containerized German exports will remain relatively stable. Again, these volume patterns should be understood as complementary to value-based trade statistics.
Three Scenarios for German Trade
Scenario 1: Gradual Stabilization (40% probability)
In this scenario, German exports stabilize at current levels as manufacturers complete restructuring, automotive EV transitions gain traction, and energy cost pressures moderate. Export volumes would remain 10-15% below historical peaks but avoid further significant declines. This requires:
- Successful automotive EV model launches regaining competitiveness
- Energy policy delivering more stable, competitive industrial electricity prices
- Trade policy uncertainties resolving without major disruptions
- Chinese competition intensifying but not escalating further
Scenario 2: Continued Structural Decline (45% probability)
This scenario assumes current trends continue, with German exports facing sustained 2-5% annual declines as Chinese competition intensifies, energy costs remain elevated, and automotive market share losses accelerate. Key assumptions:
- Chinese EV manufacturers continue gaining European market share
- German automakers struggle with software and battery technology transitions
- Energy costs remain 2-3x higher than major competitors
- Machinery and chemical sectors continue production relocations
Scenario 3: Accelerated Transformation (15% probability)
The most dramatic scenario involves rapid industrial transformation forced by market pressures, potentially triggered by major automotive restructuring (factory closures, brand consolidations) or chemical industry capacity reductions. This scenario features:
- Major German manufacturers relocating production to lower-cost regions
- Significant industrial job losses (100,000+ over 2-3 years)
- Fundamental re-evaluation of export-oriented growth model
- Shift toward services, R&D, and high-value manufacturing niches
Strategic Implications for Supply Chain Leaders
Regardless of scenario, supply chain executives dealing with Germany should prepare for:
- Volatile Container Lanes: Germany-China containerized trade routes will experience volume fluctuations as both export and import patterns shift, requiring flexible capacity planning
- Changing Product Mix: Expect continued shifts from automotive and machinery exports toward specialty chemicals, pharmaceuticals, and higher-value manufacturing equipment
- Import Container Volume Growth: German import container volumes will likely continue outpacing export container volumes as domestic manufacturers and consumers increasingly source containerized components and finished goods from Asia
- Port Capacity Adjustments: Hamburg and Bremerhaven may face overcapacity in export-handling facilities while import infrastructure sees utilization increases
- Logistics Cost Pressures: Imbalanced container volume flows create empty container positioning challenges and affect freight rates on Germany-Asia lanes
Germany's trade challenges have outsized implications because Germany accounts for 24% of EU GDP and serves as Europe's manufacturing core. German industrial weakness ripples throughout European supply chains, affecting suppliers in Central and Eastern Europe, logistics networks across the continent, and Europe's overall trade competitiveness.
German Trade in European Context:
- Share of EU total exports: ~28%
- Intra-EU trade: 55% of German exports
- German trade surplus with EU: €159.6 billion (2024)
German manufacturers supply machinery, components, and industrial equipment to factories throughout Europe. When German machine tool exports decline 5%, this affects manufacturing capabilities in Poland, Czech Republic, Spain, and other countries dependent on German equipment.
Similarly, German automotive suppliers employ tens of thousands across Europe in countries producing components for German vehicle assembly. Automotive production cuts in Germany force supply chain adjustments rippling through multiple countries.
Europe's competitiveness increasingly depends on whether Germany can successfully navigate its industrial transition while maintaining manufacturing capabilities and export strength. A Germany that retreats from industrial production toward services and finance represents a fundamentally different European economy with profound implications for employment, trade, and economic growth.
Conclusion: Navigating Transformation in Europe's Industrial Heartland
Germany's container volume patterns and broader export performance in 2024-2025 reflect an economy at a crossroads. The export-oriented growth model that powered Germany's rise as Europe's largest economy faces fundamental challenges from high energy costs, Chinese manufacturing competition, automotive industry disruption, and changing global trade patterns.
The data tells a complex story: while Germany maintains a substantial trade surplus (€239.1 billion in 2024), underlying trends reveal structural challenges. Official statistics show exports declining in value, automotive production collapsing, and machinery exports falling. Meanwhile, VIZION's container booking data reveals import volumes surging and export volumes showing modest growth—indicating shifts in product mix, with Germany potentially exporting fewer but higher-value-per-container goods while importing larger volumes of lower-value containerized products. Together, these perspectives reveal a structural adjustment requiring fundamental strategic responses rather than a temporary cyclical downturn.
For supply chain executives, these container volume developments demand proactive planning:
- German export container lanes may see sustained volume weakness, requiring capacity adjustments
- Import container flows from Asia to Germany will likely remain strong, creating opportunities in reverse logistics and container repositioning
- Automotive supply chains face continued disruption requiring alternative sourcing strategies
- Traditional Germany-China containerized trade lanes need flexible capacity management given volatile bilateral relations and shifting volume patterns
Germany retains substantial strengths: world-class engineering capabilities, strong mid-sized manufacturers (the "Mittelstand"), advanced manufacturing expertise, and financial resources for investment and transformation. The question is whether these strengths can overcome energy disadvantages, competitive pressures, and demographic headwinds in time to prevent permanent industrial capacity losses.
The coming 18-24 months will prove decisive. If German automakers successfully launch competitive EV models, energy policy delivers cost relief, and machinery exporters adapt to Chinese competition, stabilization remains possible. If these adjustments fail or prove insufficient, Germany—and Europe—face a more fundamental industrial transformation with profound economic and social implications.
Navigate German Trade Volatility with Enhanced Visibility
Understanding Germany's evolving containerized trade patterns requires real-time visibility into container movements and emerging trends. VIZION's comprehensive container tracking platform provides the data intelligence German and European supply chain leaders need to navigate uncertainty and identify opportunities in ocean freight operations.
Our solutions enable proactive decision-making through:
- Real-time container tracking across Hamburg, Bremerhaven, and major European ports
- Predictive analytics for arrival planning and capacity management
- Container volume and trade lane visibility for Germany-Asia, intra-Europe, and transatlantic routes
- Exception management for proactive issue resolution
- API integration for seamless data flow into existing systems
- Granular HS code-level insights into product category trends and shifts
Contact our team today to learn how VIZION can help your organization adapt to the new dynamics of German and European containerized trade. For more insights on supply chain technology and trade analytics, book a demo here.
All charts in this article were generated from verified data sources and fact-checked for accuracy:
1. **Chart 1 - Historical Trends**: 8 years of quarterly VIZION container booking data (2017-2024)
2. **Chart 2 - YoY Growth**: Year-over-year comparison validated against source data
3. **Chart 3 - Trade Balance**: Calculated from import/export TEU totals, cross-checked
4. **Chart 4 - 2025 Forecast**: Based on VIZION forward booking data
5. **Chart 5 - Category Changes**: HS code-level analysis from deduplicated dataset
6. **Chart 6 - Official Statistics**: German Federal Statistical Office (Destatis) official figures
---
Data Sources: VIZION API ocean container booking data (represents container volumes in TEUs from ocean bookings - a subset of total containerized trade, measuring volume not value), German Federal Statistical Office (Destatis - represents total trade values across all transportation modes), Port of Hamburg, Port of Bremerhaven, German Machinery and Equipment Manufacturers' Association (VDMA), German Chemical Industry Association (VCI), Reuters, Financial Times, Various economic research institutions. Analysis reflects data current as of November 2025.
Methodological Note: This analysis combines two complementary data perspectives: (1) VIZION container volume data measured in TEUs, useful for understanding logistics patterns, port operations, and product category trends; (2) Official German trade statistics measured in monetary value, representing overall trade balance and economic performance. Container volumes and trade values measure different aspects of trade and should not be directly compared or conflated.
%20-%202026-07-17T152701.754.png)
%20-%202026-07-17T104412.520.png)
%20-%202026-07-08T100322.158.png)


