


The U.S. plays a vital role in global trade, with goods exports at $278.5 billion and imports reaching $419 billion in March alone. The sheer scale of this trade highlights the importance of understanding where goods move in and out of the U.S. and how to track those movements accurately.
For logistics teams, global trade data allows for smarter planning, better route optimization, and reduced delays.
Real-time container tracking solutions like Vizion provide global trade intelligence and in-depth port performance data. It ensures that businesses can monitor the flow of goods across key U.S. states and make data-driven decisions for smoother operations.
The U.S. Goods Trade Industry
The U.S. trade industry is a key component of the global economy, significantly impacting both domestic and international markets. In 2024, exports of goods reached $2,083.8 billion, while imports surged to $3,295.6 billion.
This substantial trade activity highlights the critical need for businesses to track and optimize their operations, ensuring efficiency and cost control.
Top Export Trends
Exports of goods saw a notable increase of $38.6 billion in 2024. The following categories experienced the most significant changes:
- Capital Goods:
- Increased by $40.2 billion, driven by stronger demand for industrial equipment and machinery, including semiconductors and computers.
- This increase reflects the U.S.'s leading role in global manufacturing and technology exports.
- Computer Accessories:
- A growth of $11.3 billion in computer accessories indicates the increasing global demand for tech-related products.
- This is generally due to the rise in remote work and digital infrastructure worldwide.
- Passenger Cars and Automotive Components:
- Automotive exports declined to $10.8 billion, driven primarily by reduced exports of passenger cars and automotive parts.
- This was mainly due to disruptions in global supply chains and challenges in the automotive sector.
- Semiconductors: Semiconductors increased by $8.1 billion, highlighting their growing importance in global tech industries, especially consumer electronics, automotive, and industrial automation.
Top Import Trends
Imports of goods also saw substantial growth in 2024, with an overall increase of $187.1 billion. The following categories accounted for most of the rise:
- Capital Goods: Imports of capital goods surged by $103.3 billion, driven by high demand for machinery, equipment, and technology components necessary for infrastructure projects and technological advancements.
- Pharmaceutical Preparations: A significant increase of $43.6 billion in pharmaceutical imports, which was largely driven by demand for medical supplies, prescription medications, and vaccines, particularly in the aftermath of the global health challenges.
- Computer Accessories: Imports of computer accessories grew by $33.5 billion, reflecting ongoing demand in consumer electronics and business-related technology products worldwide.
- Automotive Vehicles and Parts: Imports of automotive vehicles and parts increased by $16.1 billion, marking a continued recovery in the industry, especially with the demand for electric vehicles and related parts.
Top U.S. States by Exports
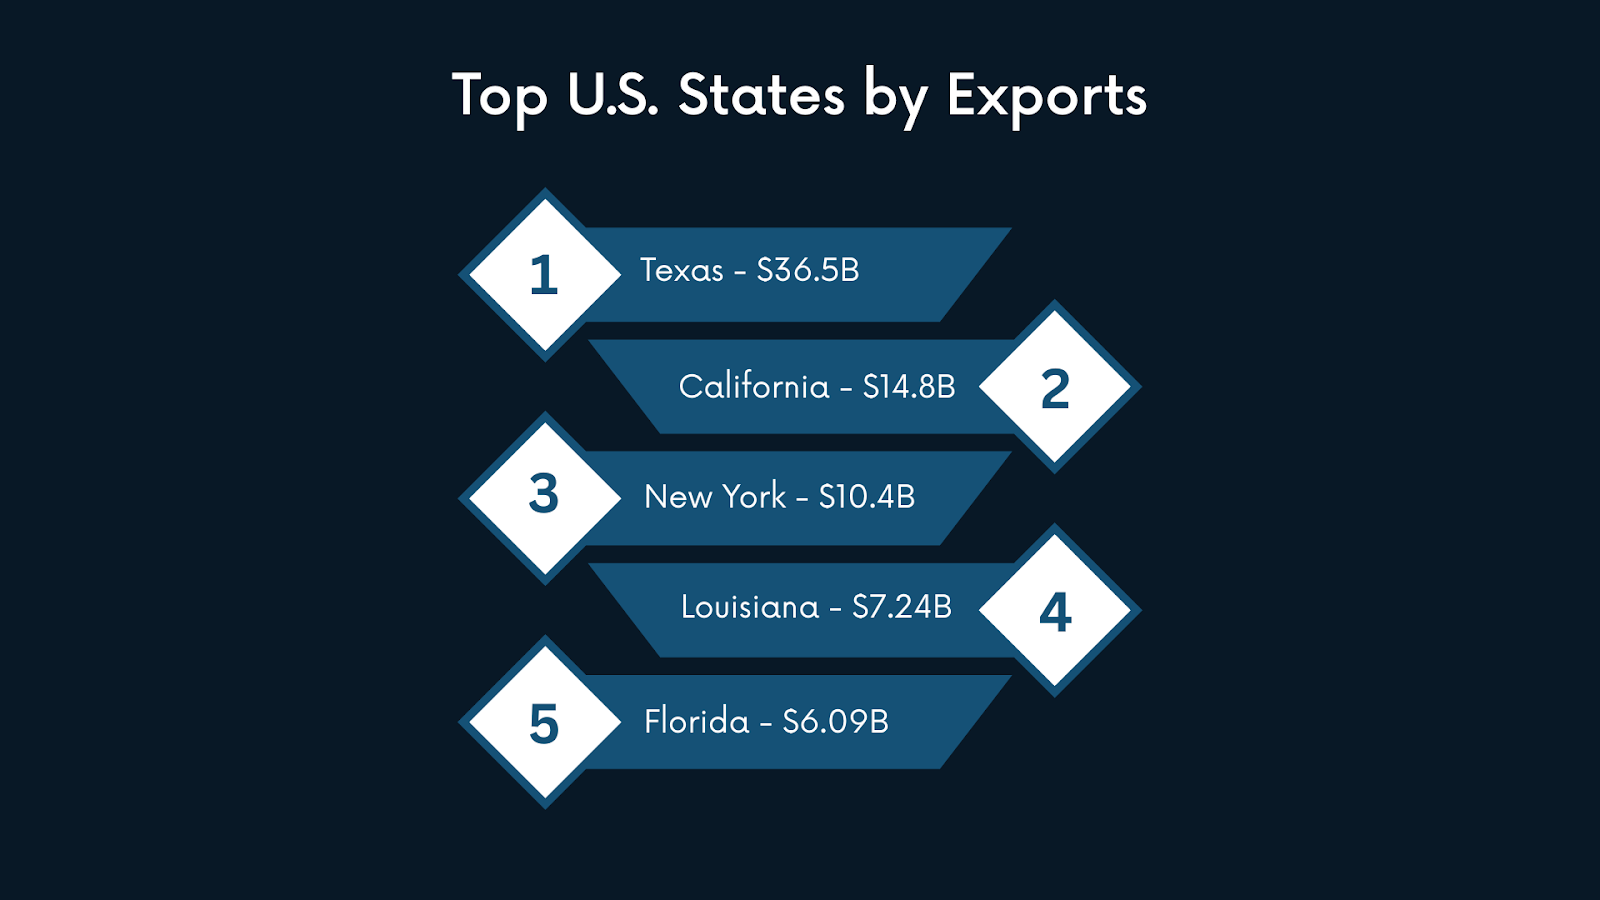
According to February 2025 data, the top U.S. exporting states have significantly contributed to the nation's export numbers. The ports in these states serve as vital gateways for various industries, enabling global trade.
The top 5 states ranked by goods export, with their key export industries.
1. Texas - $36.5B
Texas remains the leading exporter, and the Port of Houston is a key hub for a range of industries, especially energy and manufacturing.
Key Export Industries:
- Energy: Texas is the top exporter of crude oil, natural gas, and petroleum products, with the Port of Houston being one of the busiest energy export hubs in the U.S.
- Electronics: The state exports significant semiconductors, computers, and telecommunications equipment, driven by the strong presence of tech companies in cities like Austin and Dallas.
- Machinery: Texas exports industrial machinery and oilfield equipment, supporting global infrastructure projects and energy production, particularly in emerging markets.
2. California - $14.8B
California’s export strength is supported by its Port of Los Angeles and Port of Long Beach, focusing on technology, aerospace, and agriculture.
Key Export Industries:
- Technology: California exports semiconductors, computers, and electronic components, driven by Silicon Valley’s tech giants like Apple and Intel.
- Aerospace: The state is a leader in aerospace exports, including aircraft parts and civilian aircraft engines, contributing to its global aerospace dominance.
- Agriculture: California is a major exporter of fruits, nuts, wine, and vegetables, with the state’s agricultural sector playing a key role in global food exports.
3. New York - $10.4B
The Port of New York and New Jersey is one of the busiest in the country, supporting diverse exports ranging from pharmaceuticals to machinery.
Key Export Industries:
- Pharmaceuticals: New York exports pharmaceuticals and medical devices, with companies like Pfizer and Merck headquartered here, driving a significant portion of its exports.
- Machinery: Exports of industrial machinery and computers are strong, particularly from New York’s manufacturing sectors in areas like upstate New York and the Hudson Valley.
4. Louisiana - $7.24B
Louisiana’s Port of New Orleans is a critical export point for the state’s energy and agricultural sectors, bolstered by its strategic position on the Mississippi River.
Key Export Industries:
- Energy: The state exports large volumes of petroleum and chemical products, particularly refined oil, benefiting from its oil refineries and the Port of New Orleans's infrastructure.
- Agriculture: Louisiana exports rice, soybeans, and corn, with its agriculture sector contributing significantly to the global food supply.
- Chemicals: The state also exports petrochemicals and chemical products, including fertilizers and plastics produced in the Gulf region.
5. Florida - $6.09B
Florida’s Port Miami and Port Everglades are key exporters, handling various goods from aerospace to agricultural products.
Key Export Industries:
- Aerospace: Florida exports aircraft and aerospace parts, with major manufacturers like Boeing and Lockheed Martin contributing to its aerospace industry.
- Agriculture: Florida is a major exporter of citrus fruits, vegetables, and flowers, playing a crucial role in global agricultural trade.
- Pharmaceuticals: The state exports significant amounts of pharmaceutical products, particularly medicinal products and medical equipment, from its growing biotech and medical sectors.
Top U.S. States by Imports
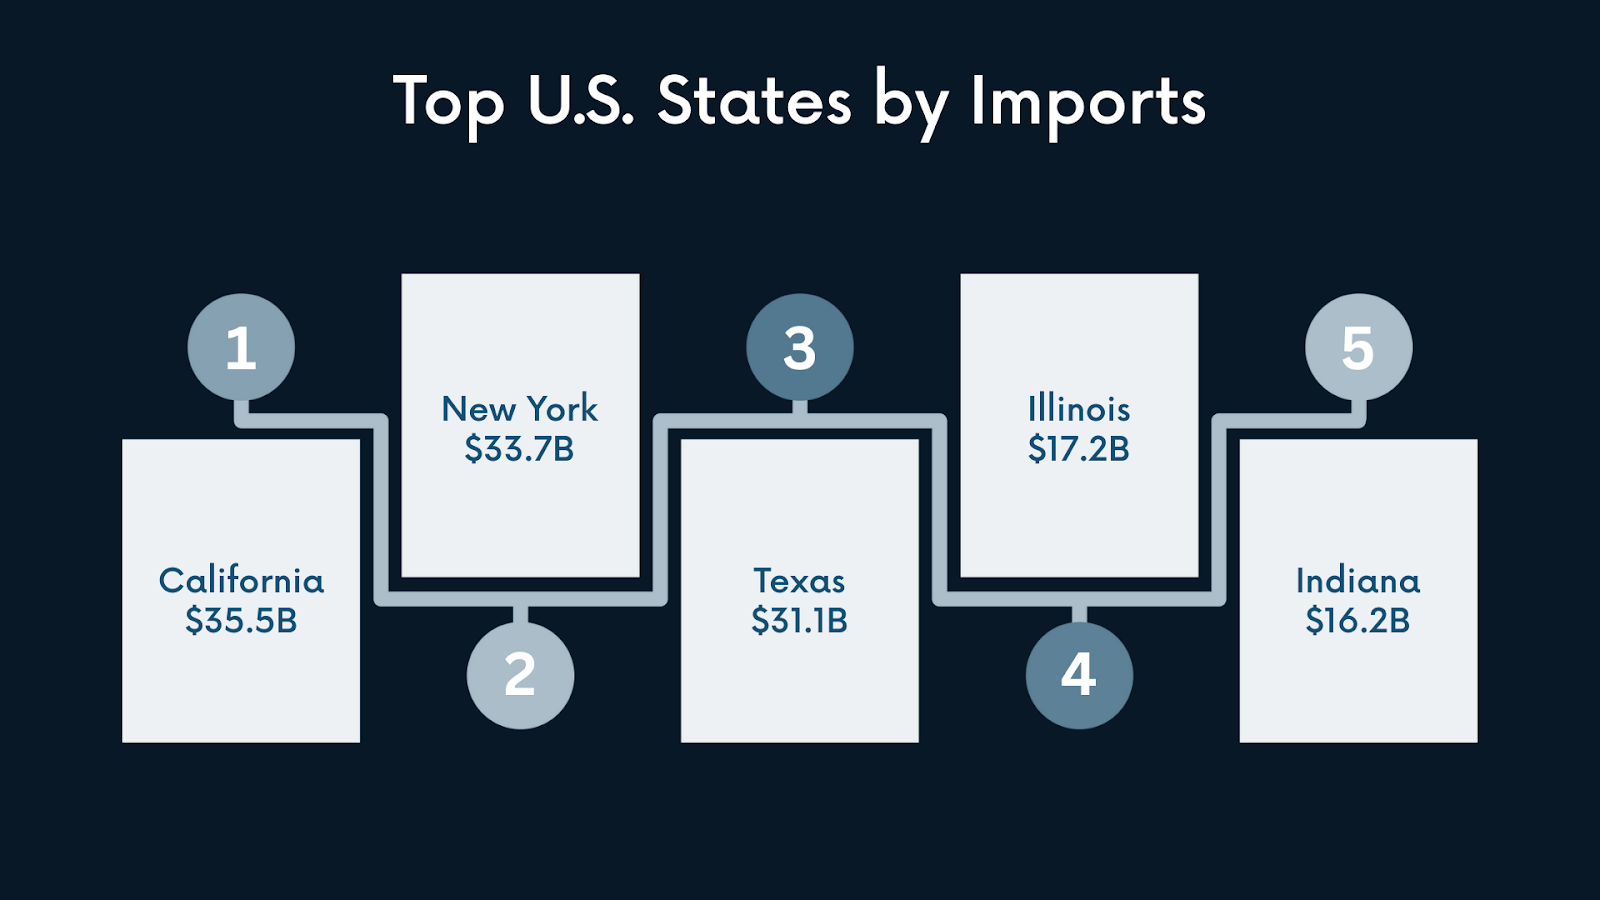
According to February 2025 data, the top U.S. importing states have significantly contributed to the nation's import figures. The ports in these states serve as critical gateways for various industries, facilitating the movement of goods to international markets.
1. California - $35.5B
California's Ports of Los Angeles and Long Beach are central to the state's import activities, handling diverse goods.
- Electronics: Imports of consumer electronics, including smartphones, computers, and televisions, are substantial, driven by demand from tech companies and consumers.
- Apparel and Footwear: The state imports large volumes of clothing and footwear, catering to its fashion industry and retail markets.
- Furniture: Significant furniture imports support California's robust home goods market, influenced by its large population and housing sector.
2. New York - $33.7B
The Port of New York and New Jersey is a central import hub, serving diverse industries nationwide.
- Consumer Goods: Imports of clothing, electronics, and home appliances are significant, meeting the demands of New York's large consumer base.
- Pharmaceuticals: The state imports a wide range of pharmaceutical products, including medicines, vaccines, and medical equipment, driven by global health demands and the state's robust healthcare sector.
- Industrial Machinery: Imports of industrial machinery support New York's manufacturing and construction industries.
3. Texas - $31.1B
Texas's Port of Houston handles substantial imports across various sectors, supporting the state's diverse economy.
- Crude Oil and Petroleum Products: Texas's significant imports of crude oil and refined petroleum products support its extensive refining capacity and energy sector.
- Electronics: Imports of semiconductors, computers, and telecommunication equipment cater to the state's growing tech industry, particularly in cities like Austin and Dallas.
- Chemicals: The state imports chemical products, including fertilizers, plastics, and pharmaceutical ingredients, essential for its manufacturing and agricultural sectors.
4. Illinois - $17.2B
The Port of Chicago is a significant entry point for a wide range of products, particularly in the automotive and machinery sectors.
- Automotive Vehicles and Parts: Illinois imports automotive vehicles and parts, supporting its automotive manufacturing base, which includes the Ford assembly plant in Chicago and a Toyota Boshoku factory in Lawrenceville.
- Industrial Machinery: The state imports industrial machinery, which is crucial for its multiple industries and helps develop the state.
- Consumer Goods: Imports of consumer goods, including electronics and textiles, cater to Illinois's large population and retail markets.
5. Indiana - $16.2B
Indiana's Port of Indiana-Burns Harbor handles significant imports, particularly machinery, chemicals, and automotive products.
- Automotive Vehicles and Parts: Indiana imports automobiles, parts, and engines, supporting its automotive manufacturing base, which includes factories for General Motors and Toyota.
- Industrial Machinery: The state imports industrial machinery, including computers, to support its industrial development.
- Chemical Products: Indiana imports chemical products, including pharmaceuticals, plastics, and fertilizers, supporting its diverse industries.
TradeView by Vizion
TradeView is an advanced solution designed to provide comprehensive insights into global trade. It enables businesses to monitor shipments in real-time, analyze trends, and manage risks effectively, making supply chain operations more efficient.
Comprehensive Global Trade Insights
TradeView gives access to over 900 million shipment records across 190 countries, providing deep visibility into global trade.
- 10M+ Shipments: Monitor millions of shipments worldwide, ensuring up-to-date tracking across global markets.
- 500M Suppliers: Access a vast network of suppliers, offering unmatched visibility into your supply chain.
- 140+ Shipment Attributes: Key data points like HS Codes, cargo value, and vessel info help you analyze shipments in detail.
Real-Time Tracking and Data Analytics
TradeView transforms how you monitor shipments with live data, enhancing decision-making and optimizing logistics operations.
- Track & Trace: Real-time tracking of containers, vessels, and goods, providing insights into delays and disruptions.
- Port & Terminal Events: Receive alerts about gate processing times, available for pickup, and more, to avoid unnecessary fees.
- Performance Insights: Monitor port performance, rail events, and terminal activity to identify inefficiencies and optimize routes.
Why TradeView?
TradeView’s global coverage, historical data, and real-time insights allow businesses to manage trends, identify risks, and optimize operations.
- Data Integrity: Trustworthy, vetted, standardized data connected to D-U-N-S® Number and Live Business Identity.
- Global Coverage: Gain insights into over 50% of global containers and unmatched visibility into the supply chain.
Conclusion
The U.S. export-import industry plays a crucial role in global trade, with the U.S. serving as a central hub for goods moving across borders. The trade volume handled by U.S. ports influences everything from production schedules to global market trends, highlighting the importance of efficient operations and timely information.
Access to real-time data and tracking is essential for optimizing logistics, minimizing delays, and cutting costs. Vizion provides the best solution for tracking containers, monitoring port performance, and analyzing global trade data, helping businesses make better decisions.
- Real-Time Container Tracking: Gain access to the most complete, standardized, and detailed container tracking events via API or user interface with real-time container data.
- TradeView: Monitor the live flow of any company's shipments 30 to 90 days before arrival at the destination and analyze trends across 10 years of historical supplier, product, and logistics movement data. With 900 million shipment records, 140+ attributes per shipment, coverage spanning 190 countries, and comprehensive HS code data, TradeView empowers data-driven decisions that optimize global trade management.
Logistics Performance Hub: Access a comprehensive suite of global logistics datasets, including Port Performance, Port Activity, and Port Pairs, to analyze shipping trends, port throughput, container dwell times, and real-time port activity, enabling smarter decision making about containerized freight movements.
%20-%202026-07-17T152701.754.png)
%20-%202026-07-17T104412.520.png)
%20-%202026-07-08T100322.158.png)


