

%20(45).png)
In global trade, speed is no longer a bonus. It is a requirement. Shippers, port operators, and supply chain managers are watching closely as key performance metrics at ports (vessel arrival to berth, berth to discharge, vessel arrival to gate-out, and container dwell time) determine whether goods move smoothly or get bottlenecked.
In our TradeView product, we capture these metrics for any port in real time. What trends are we seeing right now? In many major ports, delays are creeping up. Vessels are waiting longer for berths, containers are spending more time in terminals, and dwell times continue to stretch. These delays ripple through the system, raising costs, tying up capital, and frustrating business partners.
Below you will find a snapshot of what leading ports are reporting, what performance trends are emerging in 2025, and which ports are most impacted by congestion. If you are involved in shipping, logistics, or procurement, these are performance benchmarks you will want to watch and compare against your own operations.
Hamburg Port: Stable but Recovering
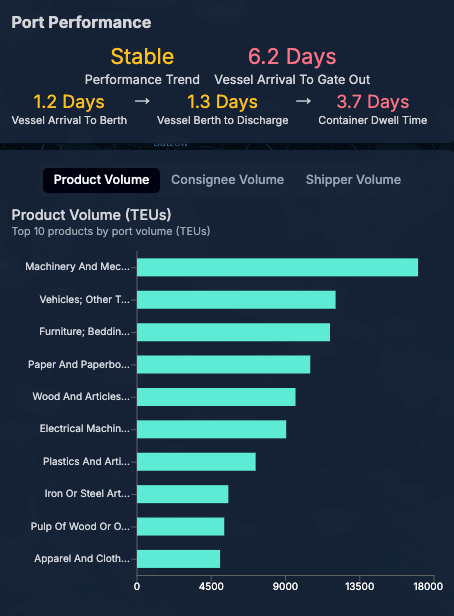
Hamburg remains one of Europe’s most important container hubs, and current performance data shows the port trending toward stability. On average, vessels take 1.2 days from arrival to berth and 1.3 days from berth to discharge, with a total of 6.2 days from vessel arrival to gate-out. Containers are spending about 3.7 days in dwell time before leaving the terminal.
The top products moving through Hamburg include machinery, vehicles, furniture, paper, and wood articles, reflecting the port’s role as a gateway for high-value manufactured goods.
Operationally, conditions are improving. According to ONE’s Europe vessel schedule report, labor shortages that previously slowed productivity are now easing, and terminal operations are gradually returning to normal. This signals a path back to efficiency for shippers relying on Hamburg as a critical trade hub.
Shanghai Port: Congestion Under Pressure
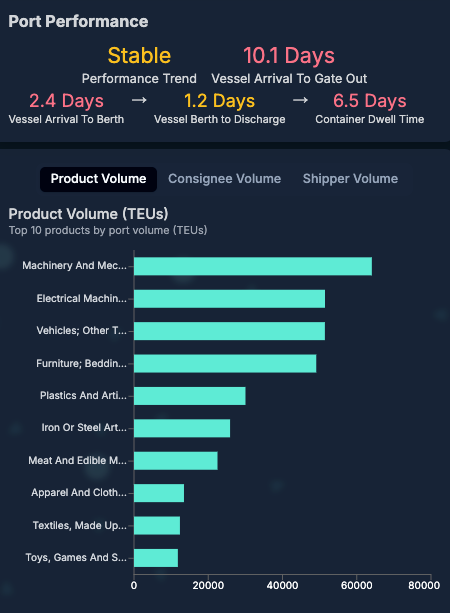
Shanghai is experiencing elevated congestion. Our latest TradeView metrics show that from vessel arrival to gate-out takes approximately 10.1 days, with 2.4 days average waiting to berth and dwell times around 6.5 days after discharge.
This aligns with recent reporting from Kuehne+Nagel, which notes Shanghai’s 7-day average vessel waiting time is about 2.19 days, driven by berth and port congestion. Check out the full report on Shanghai’s port disruptions in Kuehne+Nagel’s Port Disruption Week 33/25 Update.
These delays are not just inconvenient, they ripple across operations. Yard congestion, equipment constraints, and vessel bunching seem to be stretching both berth access and container dwell periods. What that means for shippers: longer lead times, more buffer needed, and more risk if schedules slip.
Los Angeles Port: Improving but Under Strain
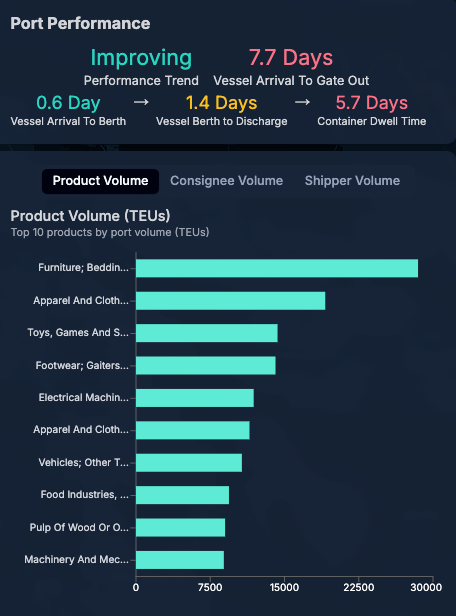
Los Angeles is showing signs of recovery, with TradeView data highlighting an overall improving performance trend. Vessels are spending just 0.6 day from arrival to berth and 1.4 days from berth to discharge, but container dwell times remain elevated at 5.7 days, bringing the full arrival to gate-out cycle to 7.7 days.
The port’s performance data aligns with recent reports from the Port of Los Angeles, which announced its busiest month on record in mid-2025. Surging container volumes (imports alone were up nearly 8% year-over-year in June) are adding pressure across terminals, even as vessel handling times improve (Port of LA News Release).
For shippers, the takeaway is clear: while vessel queuing has eased, dwell times remain a critical bottleneck that can ripple through supply chains, particularly when volume surges hit during peak season.
Global Port Performance: A Mixed Picture
Looking across Hamburg, Shanghai, and Los Angeles, a clear theme emerges: global port performance is stabilizing in some regions while remaining pressured in others.
- Hamburg shows signs of steady recovery as labor shortages ease, with berth and discharge times holding relatively stable.
- Shanghai remains under significant strain, with vessel arrival-to-berth and container dwell times extended by congestion, vessel bunching, and equipment shortages.
- Los Angeles is improving in terms of vessel handling efficiency, but record container volumes continue to stretch dwell times and slow gate-out.
For supply chain stakeholders, these differences matter. A few days lost at the berth or in dwell time at major global gateways translates into higher costs, tied-up working capital, and missed commitments downstream. Monitoring these metrics in real time provides early warning signals and creates opportunities to reroute, adjust lead times, or prepare contingency plans.
With Vizion’s TradeView product, shippers, forwarders, and port authorities can benchmark performance across any port, track where congestion is building, and act quickly to mitigate disruption. In 2025, agility comes not from reacting to the news cycle but from watching the data as it happens.
👉 Interested in other port performance data? Reach out to schedule a demo with us.
%20-%202026-07-17T152701.754.png)
%20-%202026-07-17T104412.520.png)
%20-%202026-07-08T100322.158.png)


