If you're moving cargo through the US West Coast right now, Seattle deserves your attention.
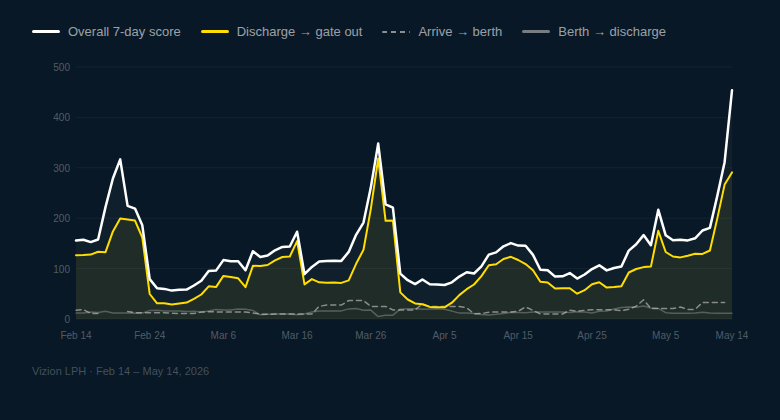
Import performance at the Port of Seattle has deteriorated sharply over the past two weeks, hitting its worst reading in at least 90 days as of May 14. The 7-day average performance score — a composite of vessel arrival, terminal dwell, and gate-out times — climbed to 453 hours, up from around 68 hours in early April. That's a more than 6x degradation in six weeks.
The culprit is dwell time. The discharge-to-gate-out window (how long a container sits at the terminal after being unloaded) has surged to 291 hours — nearly double what it was just two weeks ago. Arrive-to-berth times also jumped, hitting 33 hours, suggesting vessel congestion is compounding terminal bottlenecks.
This isn't Seattle's first spike of the year — there were notable disruptions in late February and late March — but this one is different. Those earlier spikes resolved within days. The current escalation has been building steadily since May 4, with no sign of reversal yet.
What to watch: Whether the arrive-to-berth figure continues climbing. If vessel queues lengthen alongside persistent dwell, that's a compounding problem for anyone with time-sensitive cargo.
Global Snapshot: Biggest Movers This Week
Beyond Seattle, this week's data flagged significant volatility across multiple regions.
Import Performance
| Port | Region | Change |
|---|
Seattle, USA | North America West Coast | +1,718 hrs +1,143% |
Dar Es Salaam, Tanzania | East Africa | +1,931 hrs +433% |
Benghazi, Libya | North Africa | +2,751 hrs +559% |
Port Gentil, Gabon | West Africa | +3,557 hrs +1,445% |
Dar Es Salaam stands out because its deterioration is confirmed by year-over-year data — this isn't a statistical blip, it reflects a genuine and sustained capacity strain at one of East Africa's most critical trade gateways.
| Port | Region | Change |
|---|
Aalborg, Denmark | Europe | −1,861 hrs ~98% improvement |
Yokkaichi, Japan | East Asia | −1,648 hrs ~98% improvement |
Mostaganem, Algeria | North Africa | −2,566 hrs Significant recovery |
Export Performance
| Port | Region | Change |
|---|
Montevideo, Uruguay | South America East Coast | +1,990 hrs |
Shuwaikh, Kuwait | Middle East | +1,678 hrs |
Kolkata, India | South Asia | +952 hrs |
Chongqing, China | China / Inland | +795 hrs |
Chongqing is worth noting for a different reason than the others. As a major inland port and key node in China's rail-to-sea trade corridors, export slowdowns there can have upstream effects that don't always show up immediately at coastal ports.
| Port | Region | Change |
|---|
Ad Dammam, Saudi Arabia | Middle East | −1,121 hrs |
Jubail, Saudi Arabia | Middle East | −906 hrs ~97% improvement |
Lomé, Togo | West Africa | −786 hrs ~94% improvement |
The Saudi export rebound is notable — both Jubail and Ad Dammam posted dramatic improvements this week after what appears to have been a volatile stretch. Middle East export performance is worth tracking closely in coming weeks.
What This Means for Your Operations
US West Coast routing decisions: If Seattle is in your lane, factor in potentially multi-day dwell delays until the current trend reverses. Nearby alternatives or transshipment options may be worth modeling.
East Africa contingency planning: Dar Es Salaam's degradation is real and data-confirmed. Shippers relying on this corridor should pressure-test their buffer times.
Middle East export windows: Saudi port performance swings sharply week-to-week right now. Build flexibility into export booking lead times out of the Gulf.
About this data
Performance metrics are sourced from Vizion LPH, which tracks import and export milestones — vessel arrival, berth, discharge, gate-out, gate-in, load, and departure — across hundreds of global ports. The 7-day performance score is a composite metric with built-in week-over-week and year-over-year comparisons. Data current as of May 14, 2026.


%20-%202026-05-14T113237.842.png)
%20-%202026-06-26T085742.804.png)
%20-%202026-06-18T114500.123.png)
%20-%202026-06-10T090321.318.png)


