

%20-%202026-06-10T090302.783.png)
Aluminum's Quiet Reshuffle: UAE Down 68%, US Imports Flat
The aluminum headlines in early June 2026 are loud: the Strait of Hormuz crisis, Gulf smelters offline, LME prices at four-year highs. Market reporting from Wood Mackenzie and others puts spot levels well above $3,500 per ton, with Midwest premiums at multi-year highs.
The shipment data tells a quieter story underneath the price noise, and it is the more useful one for anyone sourcing the metal. The United States has not lost its aluminum. It has changed where the metal comes from, and the change is happening faster than customs releases show.
The number that frames everything
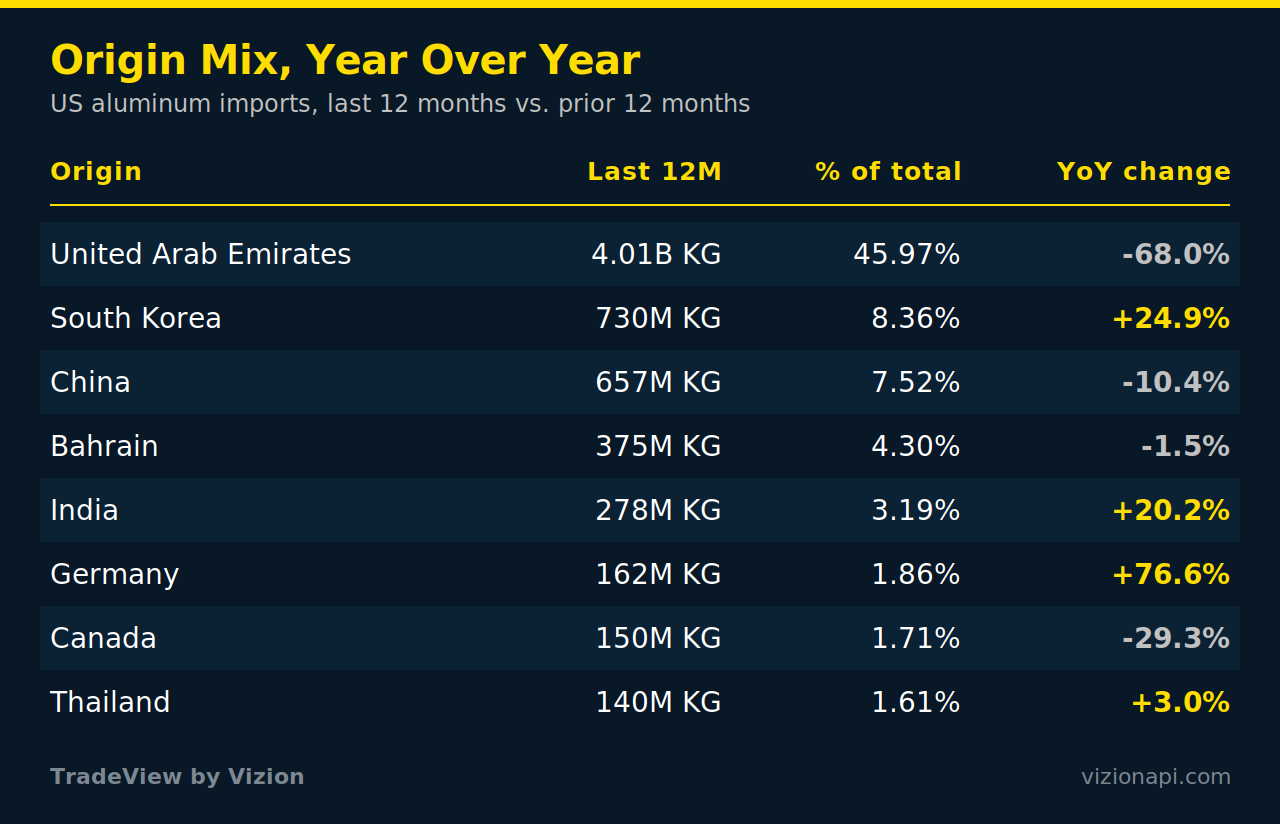
Over the last 12 months, US aluminum imports from the United Arab Emirates fell 68% year over year, from roughly 12.5 billion kilograms to about 4 billion. Roughly 8.5 billion kilograms of supply left the largest single corridor into the US market.
You would expect that to crater total imports. It did not. Total US aluminum import volume over the most recent six months came in within 1% of the prior six months. The supply did not disappear. It moved.
Origin mix, year over year
The UAE is still the number one source at almost half of total weight, but the trend underneath the top line is a scramble to diversify.
The recent six months tell a different story than the year
This is the part worth reading carefully, because the two windows disagree on purpose. Year over year, Canada is down 29%. Over the most recent six months, Canada is up 88%. Both are correct. Canadian volume fell sharply after the 50% Section 232 tariff landed, then rebounded hard as buyers decided they needed accessible supply more than they needed to avoid the tariff. The six-month window is the leading edge of where sourcing is actually heading.
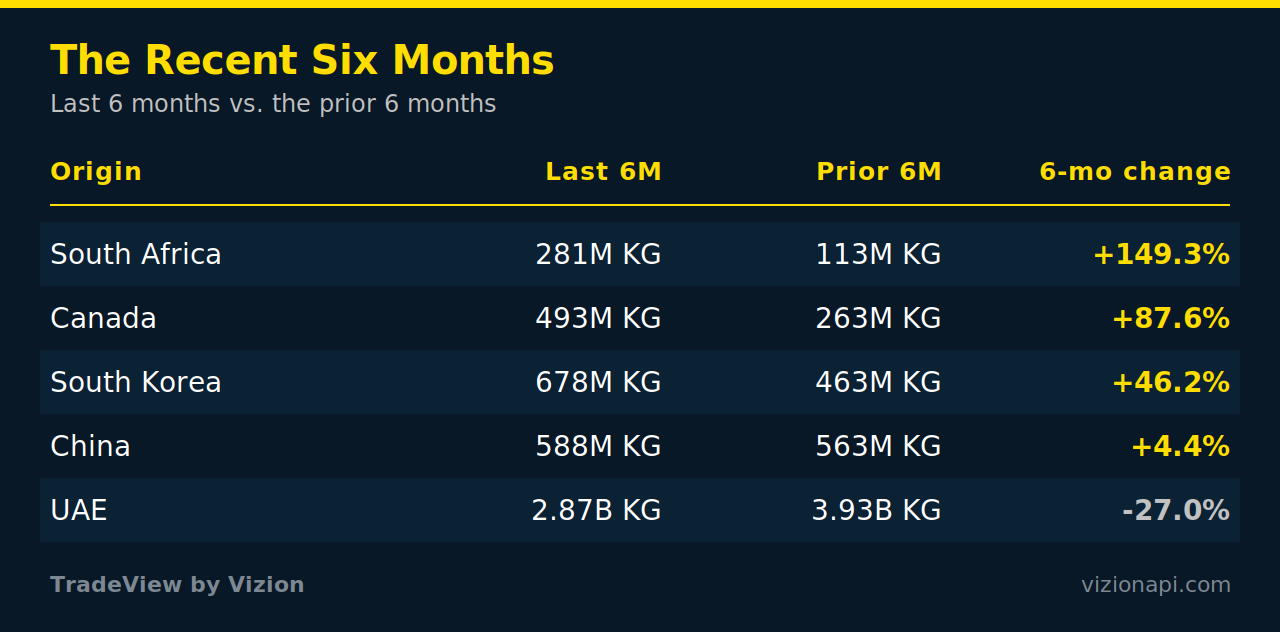
South Africa rising from almost nothing points to sourcing teams locking in entirely new relationships rather than waiting out the disruption. The UAE is still falling, not bottoming, which means the gap is likely to widen before it closes.
Who is actually buying it
US aluminum imports are concentrated in a short list of buyers. The ranking below covers the top importers over the last 12 months by gross weight, with each one's primary origin country. These are volume and origin figures, not a commentary on any company's standing.
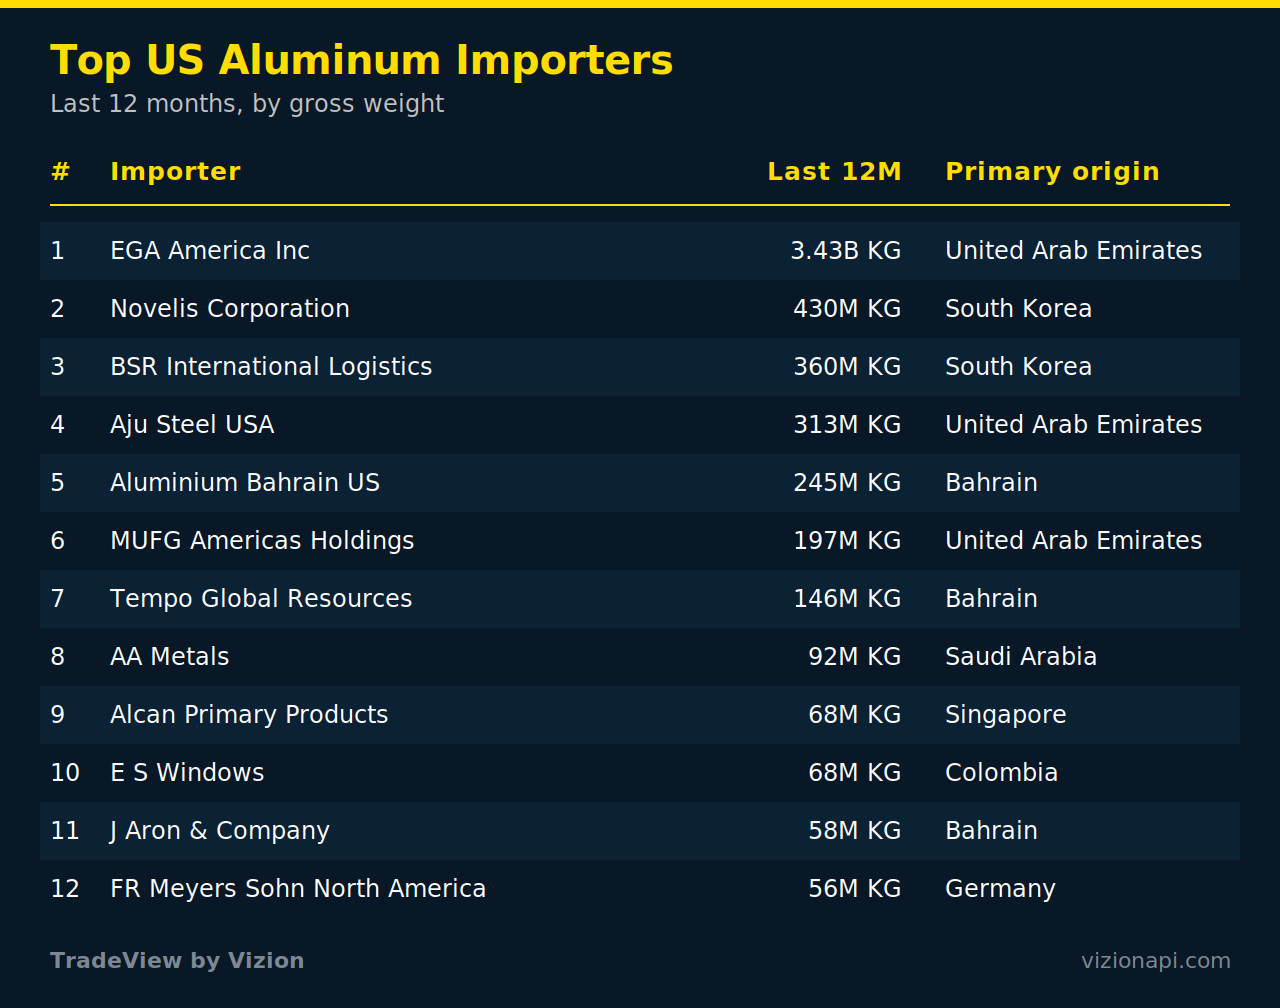
Two patterns stand out. The single largest importer accounts for more than half of the top-30 volume on its own and sources almost entirely from the UAE, so import concentration, not just country mix, is part of the picture. And several names on the list are commodity trading and finance firms rather than manufacturers, which is why a country-level supply shift moves through traders before it reaches the factory floor.
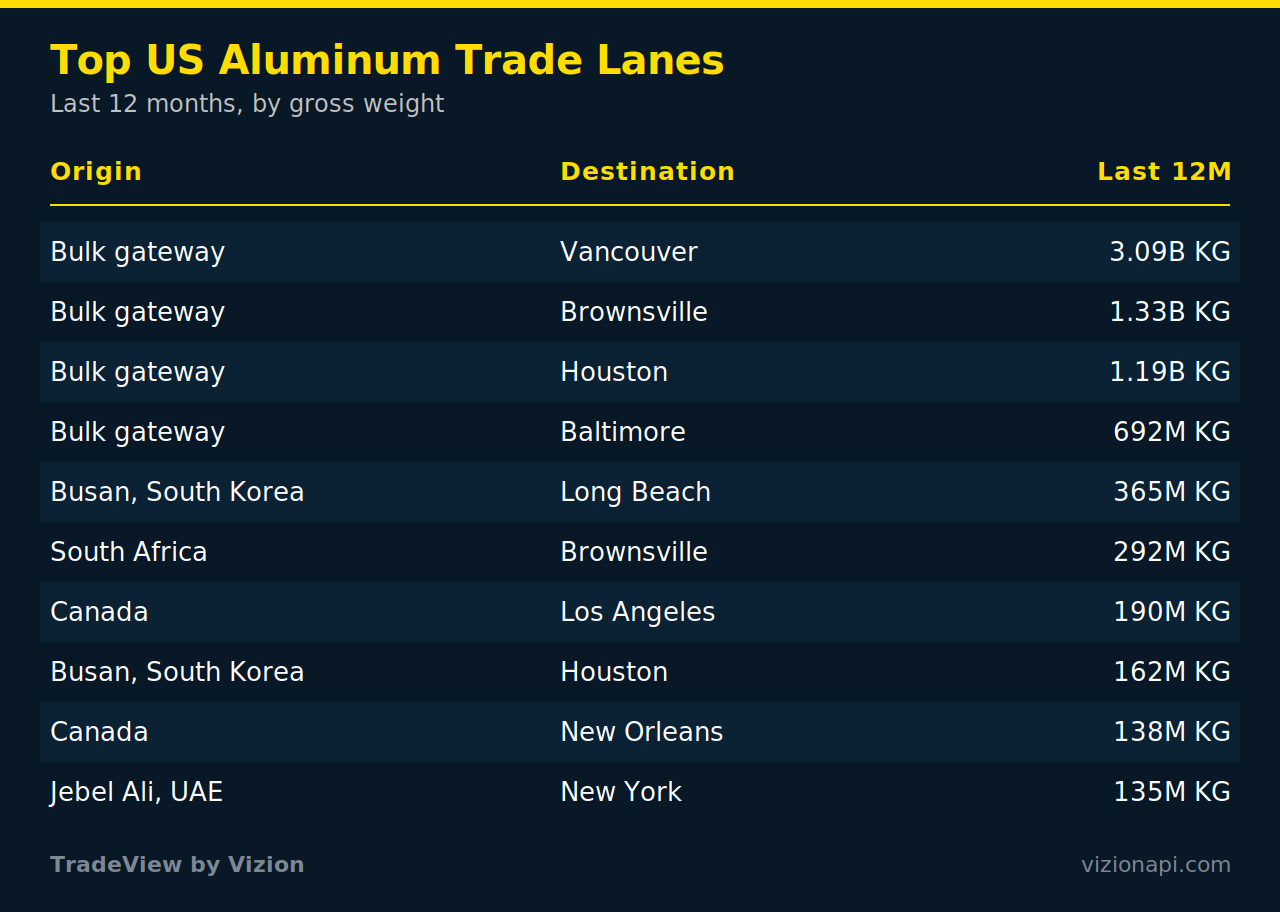
Top US aluminum trade lanes
The origin shift shows up at the ports. Over the last 12 months, the heaviest volume moved as bulk and breakbulk into Vancouver, Brownsville, Houston, and Baltimore, with Vancouver far ahead as the Canadian gateway. On the containerized side, Busan to Long Beach is the largest identified lane, the South Africa to Brownsville corridor is new and growing, and the UAE lanes into New York through Jebel Ali and Khalifa Port are still running but thinning. MSC, Maersk, COSCO, and CMA CGM carry most of the containerized volume, so there is no single-carrier dependency.
The pinch point to watch
Not all aluminum is equally exposed. The breakdown by product category shows where a smelter disruption lands first.
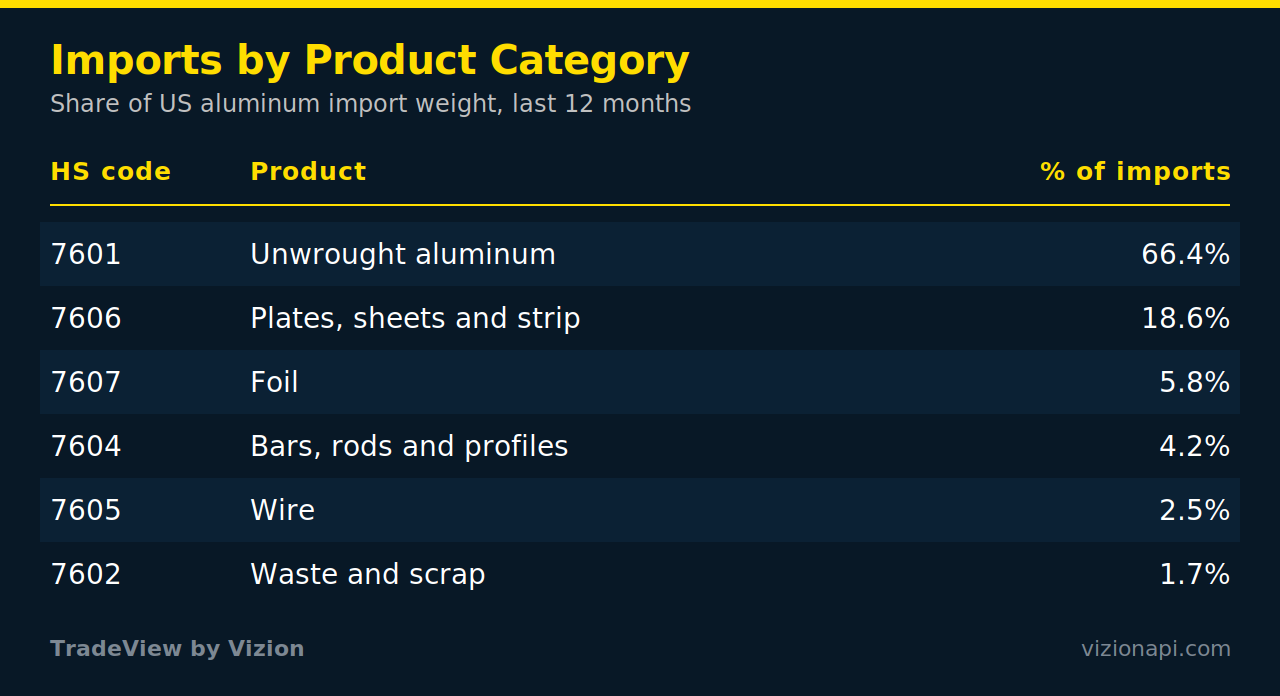
Unwrought aluminum, HS 7601, is two-thirds of total import weight and the category tied most directly to primary smelter output. That is what the Gulf disruption hits first and hardest. Plates and sheets, HS 7606, feed automotive, aerospace, and construction. If you want a single indicator for how the supply shock is actually landing, watch unwrought volume by origin, not the LME ticker.
How aluminum gets from mine to market
To see why a Gulf disruption hits US buyers so hard, it helps to follow the metal. Aluminum starts as bauxite ore, mostly from Guinea and Australia. Bauxite is refined into alumina, then smelted into primary aluminum, an extremely energy-intensive step where electricity can be 30 to 40% of production cost. That primary metal is then rolled, extruded, or cast into the sheet, foil, wire, and profiles that reach end markets. The Gulf states sit at the smelting stage, roughly 9% of global primary supply, and primary smelter output is exactly the unwrought category that makes up two-thirds of US imports. A shock at the smelting stage flows straight into the most import-dependent part of the chain.
.png)
Why the aluminum shift is likely to persist
Smelters do not switch back on quickly. Restarting one means bringing individual cells back online a handful at a time, a process that runs roughly 12 to 18 months from a cold state. Add about 60 days of ocean transit to reach North America, and the timeline for Gulf supply to fully return stretches toward late 2027 in the most optimistic case. That is the core reason the origin shift in the data is structural rather than a brief blip. Buyers building new relationships with Canada, South Korea, and South Africa are not hedging a one-quarter problem.
The demand pressure nobody had priced in
The supply story has a demand-side twin. Alongside tariffs and the Gulf disruption, the buildout of AI data centers has emerged as a structural new draw on aluminum, used heavily in racks, enclosures, busbars, and cooling hardware. This is a different kind of pressure than a cyclical construction or auto swing, because data center capacity is being added quickly and continuously. Vizion's data tracks the supply and flow side rather than end-use demand, but the signal matters for context. Even if Gulf supply normalizes on schedule, a new and growing consumer of primary metal is entering the market at the same time.
Why this shows up early in shipment data
Origin shifts like Canada doubling or South Africa appearing from nowhere form in booking and shipment records before they settle into official customs statistics. For a sourcing or risk team, that lead time is the difference between adjusting a supply plan and reacting to a shortage after it lands at port. The reshuffle described above was visible in shipment data while the consensus story was still about prices.
What the data does not tell you
Volume direction is clearer than price. The origin shifts are already in the data and are likely to continue, with the UAE declining further as the last pre-crisis pipeline shipments deplete. Price is the wildcard, tied to a geopolitical situation that no dataset forecasts well. The honest read is that the source map is the part you can plan around right now. Price is the part you hedge.
The supply chain is reshuffling in real time. The companies that see the new map first are the ones already adjusting to it.
See the shift before it hits your supply chain
TradeView turns global shipment data into early warning on the moves that matter, broken down by commodity, country, and company. The reshuffle above was visible in the data weeks before it reached the headlines. Schedule a TradeView demo below.
%20-%202026-07-17T152701.754.png)
%20-%202026-07-17T104412.520.png)
%20-%202026-07-08T100322.158.png)


