Unlock Unprecedented Insights with Custom Research & Data Services from Vizion
We go beyond standard reports. Our expert team leverages our exclusive trade and ocean freight datasets to answer your most critical business questions.
Define your research objectives: Clearly articulate your business questions and research goals.
Leverage our exclusive datasets: Access our vast repository of trade data, including vessel movements, port congestion, carrier performance, and more.
Conduct in-depth analysis: Employ advanced analytical techniques to uncover hidden patterns, identify trends, and generate actionable insights.
Deliver customized reports and visualizations: Receive comprehensive reports, interactive dashboards, and data visualizations tailored to your specific needs.
Provide ongoing support: Our team will be available to answer your questions and provide ongoing support throughout the research process.
Request a data sample
Thank you! Your submission has been received!
Oops! Something went wrong while submitting the form.


Examples of custom research projects we can help with:
- CHINA to MEXICO: Shifts in Global Trade Patterns
- Port Strike Analysis
- Ocean Carrier Reliability for specific port pairs
- Ocean Carrier ETA Analysis
- Sector and Industry Supply Forecasting - Green Coffee
- Carrier Negotiation Support Insights
- Supplier Risk Audit - review a companies suppliers to identify if they or up the chain suppliers are flagged for sanctions, etc.
- Supply Chain Network Performance Audit
Data breadth that powers insights:
- Monitor: Track and monitor over 10 million monthly shipments globally, providing unparalleled visibility into the global supply chain.
- Companies Named: Leverage data on over 7.5 million companies worldwide to gain unparalleled market insights.
- Network of Suppliers: Uncover new business opportunities within our expansive network of over 2 million suppliers.
- Vessel Movements: Track over 6,000 vessels across the globe in real-time, including their position, speed, course, and estimated time of arrival (ETA) at major ports.
- Port Congestion: Monitor real-time congestion levels at over 900+ ports worldwide, allowing you to proactively adjust routes and avoid delays.
- Trade Flows: Analyze historical and current trade data for major trade lanes, including 1,000 region pairs giving you insights into import/export volumes, key trading partners, and emerging trends.
- Carrier Performance: Compare the performance of 30 major ocean carriers based on metrics like on-time delivery rates, schedule reliability, and blank sailings, enabling you to make informed decisions about your shipping partners.
Who This Data Serves:
Ocean Carriers
Optimize fleet deployment, improve service reliability, and enhance customer relationships.
Cargo Owners
Optimize inventory management, reduce shipping costs, improve supply chain visibility, and enhance overall supply chain resilience.
Freight Forwarders
Offer enhanced services, improve operational efficiency, and gain a competitive edge.
Importers & Exporters:
Gain greater visibility into their supply chains, reduce costs, and improve decision-making.
Logistics Providers
Enhance service offerings, improve customer satisfaction, and optimize their own operations.
Capital Markets
Enhance trading capabilities, improve risk management, and optimize portfolio performance.
Sample TradeView Reporting
Below you will find sample reporting for major disruptions impacting global trade. These reports provide key insights into the effects of unexpected events on supply chains, helping businesses navigate risks and plan proactively? Interested in a specific data sample? Book a meeting below.
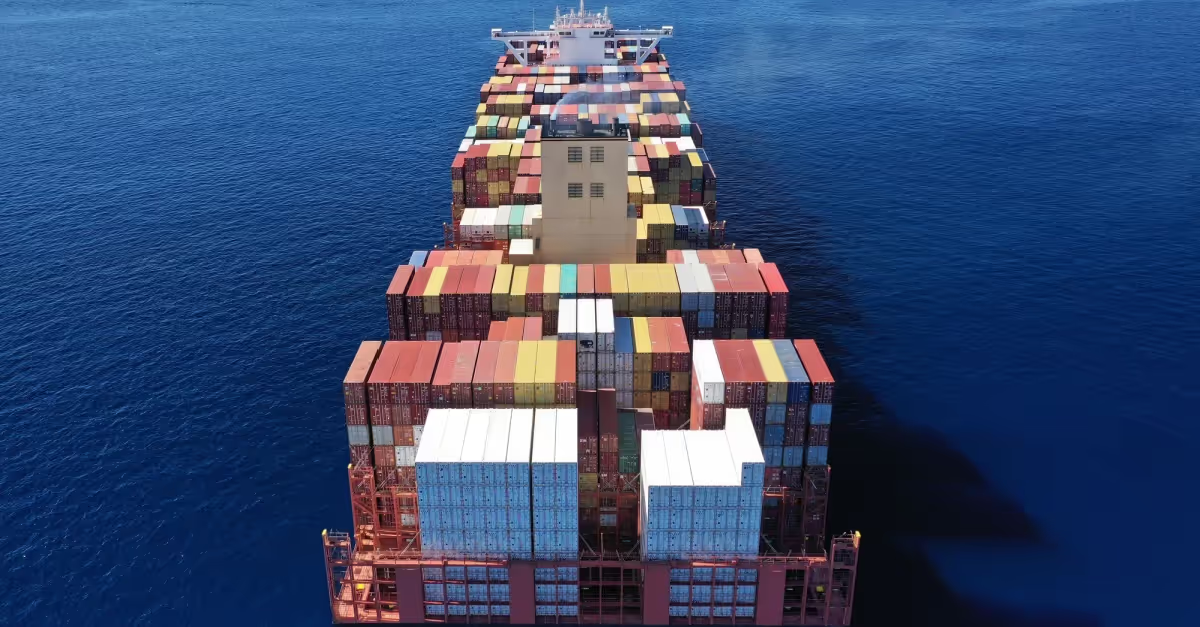
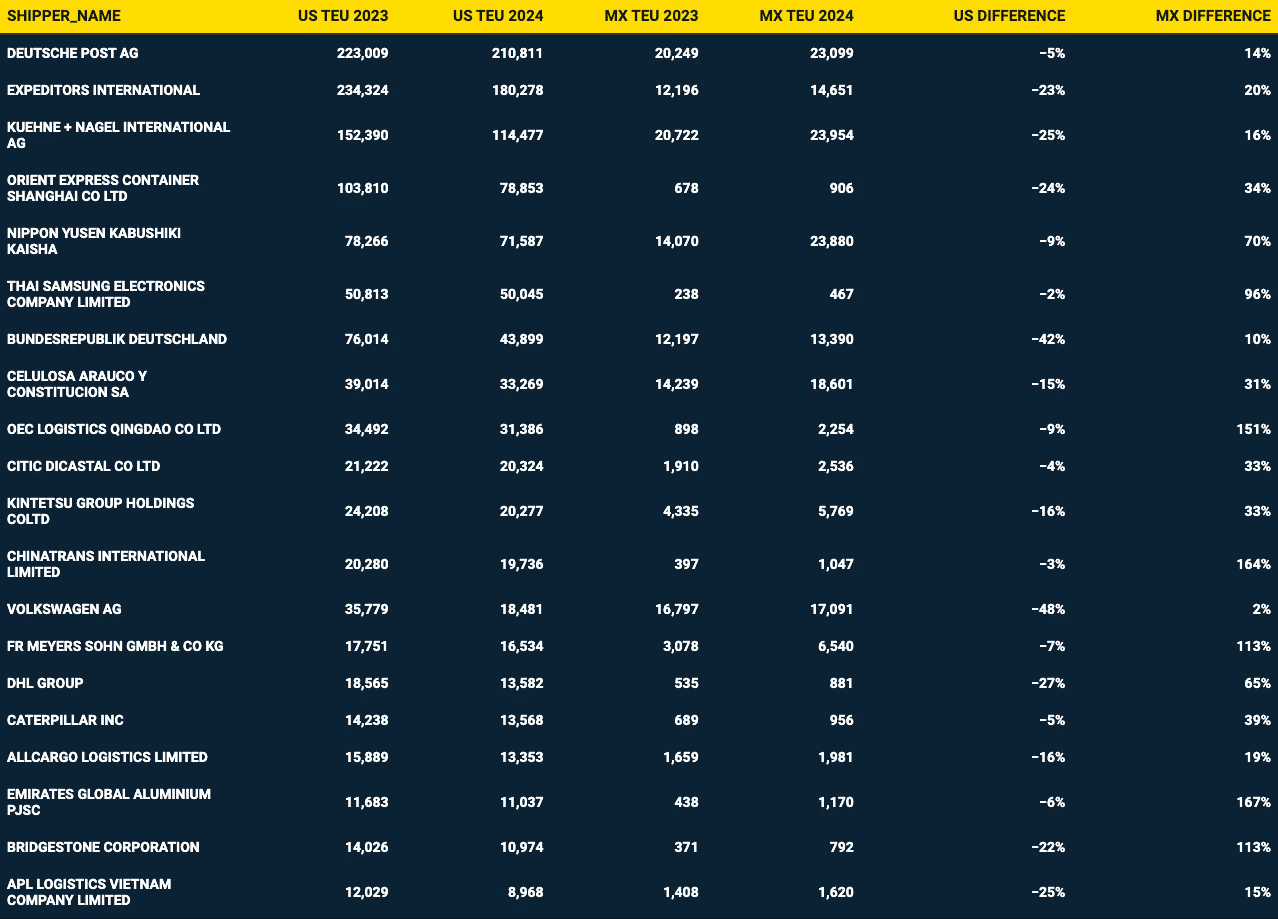
US | Mexico Imports by Shipper 2023 + 2024 TEU Comparison
Data qualified by: US lost TEU share from 2023 to 2024 | Mexico gained TEU share from 2023 to 204. Data shown is a sample size.
Key Editorial Insights:
- Nearshoring activity between US and Mexico continued to accelerate from 2024 to 2025.
- Trade lanes between Mexico and key US hubs show measurable shifts in shipment volume, particularly in automotive and manufacturing industries
Products Scheduled to Arrive/Depart The Port of Baltimore during the Bridge Collapse
Data qualified by: Import and export TEU volume scheduled to arrive at The Port of Baltimore by HS code/product type. Data shown is a sample size.
Key Editorial Insights:
- The collapse caused immediate post congestion, diverting shipments to alternate East Coast ports.
- Top importers and exporters in wood and machinery faced significant disruptions.
Want a custom dataset?
Schedule time below.
Trusted by 40+ companies


